

This page describes a new V2 version of the Prometheus exporter. For information about the old Prometheus exporter, see the Prometheus V1 docs.
Activation
Activating this integration is simple.-
Navigate to the integrations tab on the account screen and click the ‘Create Prometheus endpoint’ button.

-
We directly create an endpoint for you and provide its URL and the required Bearer token.
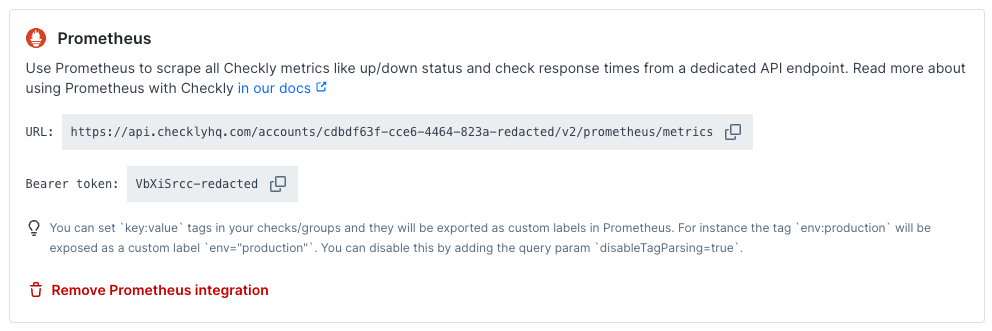
-
Create a new job in your Prometheus
prometheus.ymlconfig and set up a scraping interval. The scrape interval should be above 60 seconds. Add the URL (divided intometrics_path,schemeandtarget) andbearer_token. Here is an example
The Prometheus metrics endpoint has a rate limit of 50 requests per minute.
The responses from this endpoint are cached during 60 seconds.
Any request made to this endpoint within 60 seconds of the initial request will receive the cached response.
We recommend using a scrape interval of 60 seconds.
Check Metrics
The Prometheus exporter exposes several metrics you can use to monitor the status of your checks, as well as to inspect detailed information such as Web Vitals. The following metrics are available to monitor checks:
The
checkly_check_status and checkly_check_result_total metrics contain a status label with values passing, failing, and degraded.
The checkly_check_status gauge is 1 when the check has the status indicated by the status label and is 0 otherwise.
For example, if a check is passing the result will be:
checkly_check_status can be useful for viewing the current status of a check, whereas checkly_check_result_total can be useful for calculating overall statistics.
The metrics checkly_browser_check_web_vitals_seconds, checkly_browser_check_errors, and checkly_api_check_timing_seconds contain a type label.
This label indicates the different Web Vitals, error types, and timing phases being measured.
checkly_time_to_ssl_expiry_seconds contains a domain label giving the domain of the monitored SSL certificate.
In addition, the check metrics all contain the following labels:
You can setkey:valuetags in your checks and groups and they will be exported as custom labels in Prometheus. For instance the tagenv:productionwill be exposed as a custom labelenv="production". You can disable this by adding the query paramdisableTagParsing=true. Please note that Prometheus label names may only contain ASCII letters, numbers, as well as underscores (see the official docs). Tags containing other characters in the label name will be sanitized.
The counter and histogram metrics are reset every hour. These resets can be handled in Prometheus by using the rate or increase functions.
PromQL Examples
This section contains a few PromQL queries that you can use to start working with the Prometheus data.Currently failing checks
To graph whether checks are passing or failing, use the query:1 while failing and degraded checks will have the value 0.
This can be used to build a Grafana table of currently failing checks.
Failure percentage
To calculate the percentage of check runs that failed in the last 24 hours, use:Histogram averages
The different histogram metrics can all be used to compute averages. For example, query the average web vitals times for a check using:Private Location Metrics
The Prometheus exporter also contains metrics for monitoring Private Locations. These metrics can be used to ensure that your Private Locations have enough Checkly Agent instances running to execute all of your checks. The following metrics are available to monitor Private Locations:
The Private Location metrics all contain the following labels: