> ## Documentation Index
> Fetch the complete documentation index at: https://checkly-422f444a-mda-troubleshooting-section.mintlify.site/llms.txt
> Use this file to discover all available pages before exploring further.
# Results
> Learn about the results of Checkly
Check **Results** are the outcomes of every monitoring test that Checkly runs. You can select any check on the main Checkly dashboard to get an overview of the results they have produced so far. Select a check and you will see a breakdown of its recent runs, together with key availability and performance metrics.
Each time a Check executes—whether it's testing an API endpoint, clicking through a user flow, or verifying a service connection—it generates a **Result** that captures everything that happened during that test run.
**Results** are more than just pass or fail indicators. They're comprehensive records that include performance metrics, error details, screenshots, network traces, and any other telemetry that helps you understand not just whether something worked, but how well it worked and why it might have failed.
## Understanding Result Data
You can select any check on the main Checkly dashboard to get an overview of the results they have produced so far.
## Check results overview
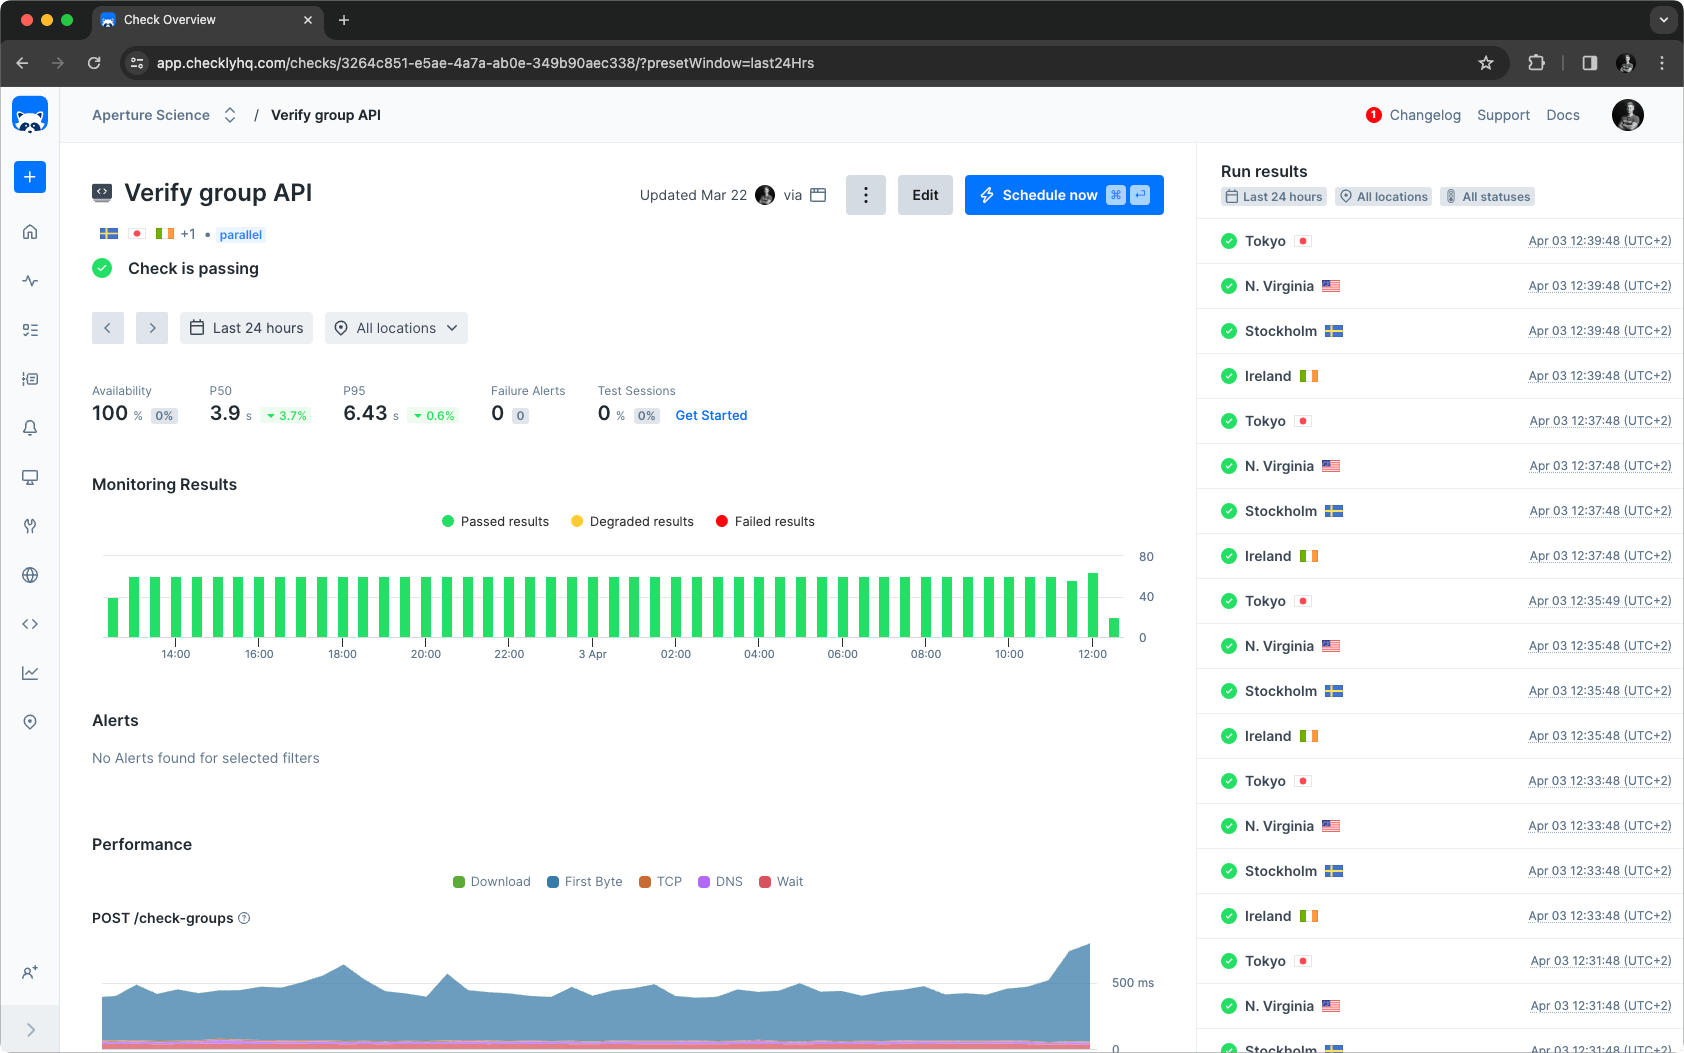
Select a check and you will see a breakdown of its recent runs, together with key availability and performance metrics.
 ### Summary section
The summary at the top of the page allows for filtering based on the page's data points and the selected timeframe and locations. Retried check runs do not influence this section; only the final results are considered.
### Summary section
The summary at the top of the page allows for filtering based on the page's data points and the selected timeframe and locations. Retried check runs do not influence this section; only the final results are considered.
 Based on the user's selection, the metrics in the summary will also be updated to show the most important numbers at a glance.
### Monitoring results chart
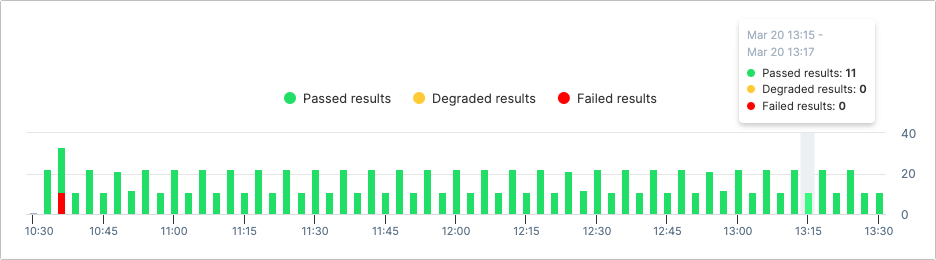
The monitoring results chart shows a summary of the run results in the selected time period where each bar represents a part of that time period. You can change the time period in the summary section.
Hovering a bar in the chart will show the results of all check runs executed during that time. You can quickly filter the check run results in the right sidepanel by clicking a bar in the chart.
Based on the user's selection, the metrics in the summary will also be updated to show the most important numbers at a glance.
### Monitoring results chart
The monitoring results chart shows a summary of the run results in the selected time period where each bar represents a part of that time period. You can change the time period in the summary section.
Hovering a bar in the chart will show the results of all check runs executed during that time. You can quickly filter the check run results in the right sidepanel by clicking a bar in the chart.
 When retries are enabled, an additional icon highlights that the check result contains multiple check runs.
### Monitoring results sidebar
On the right side you can view the check result broken down per check run and location for the selected time frame. If you select a bar in the monitoring results chart it will filter out the corresponding results in the sidebar. Click any result to navigate to the check results screen for detailed information about the check run.
### Performance
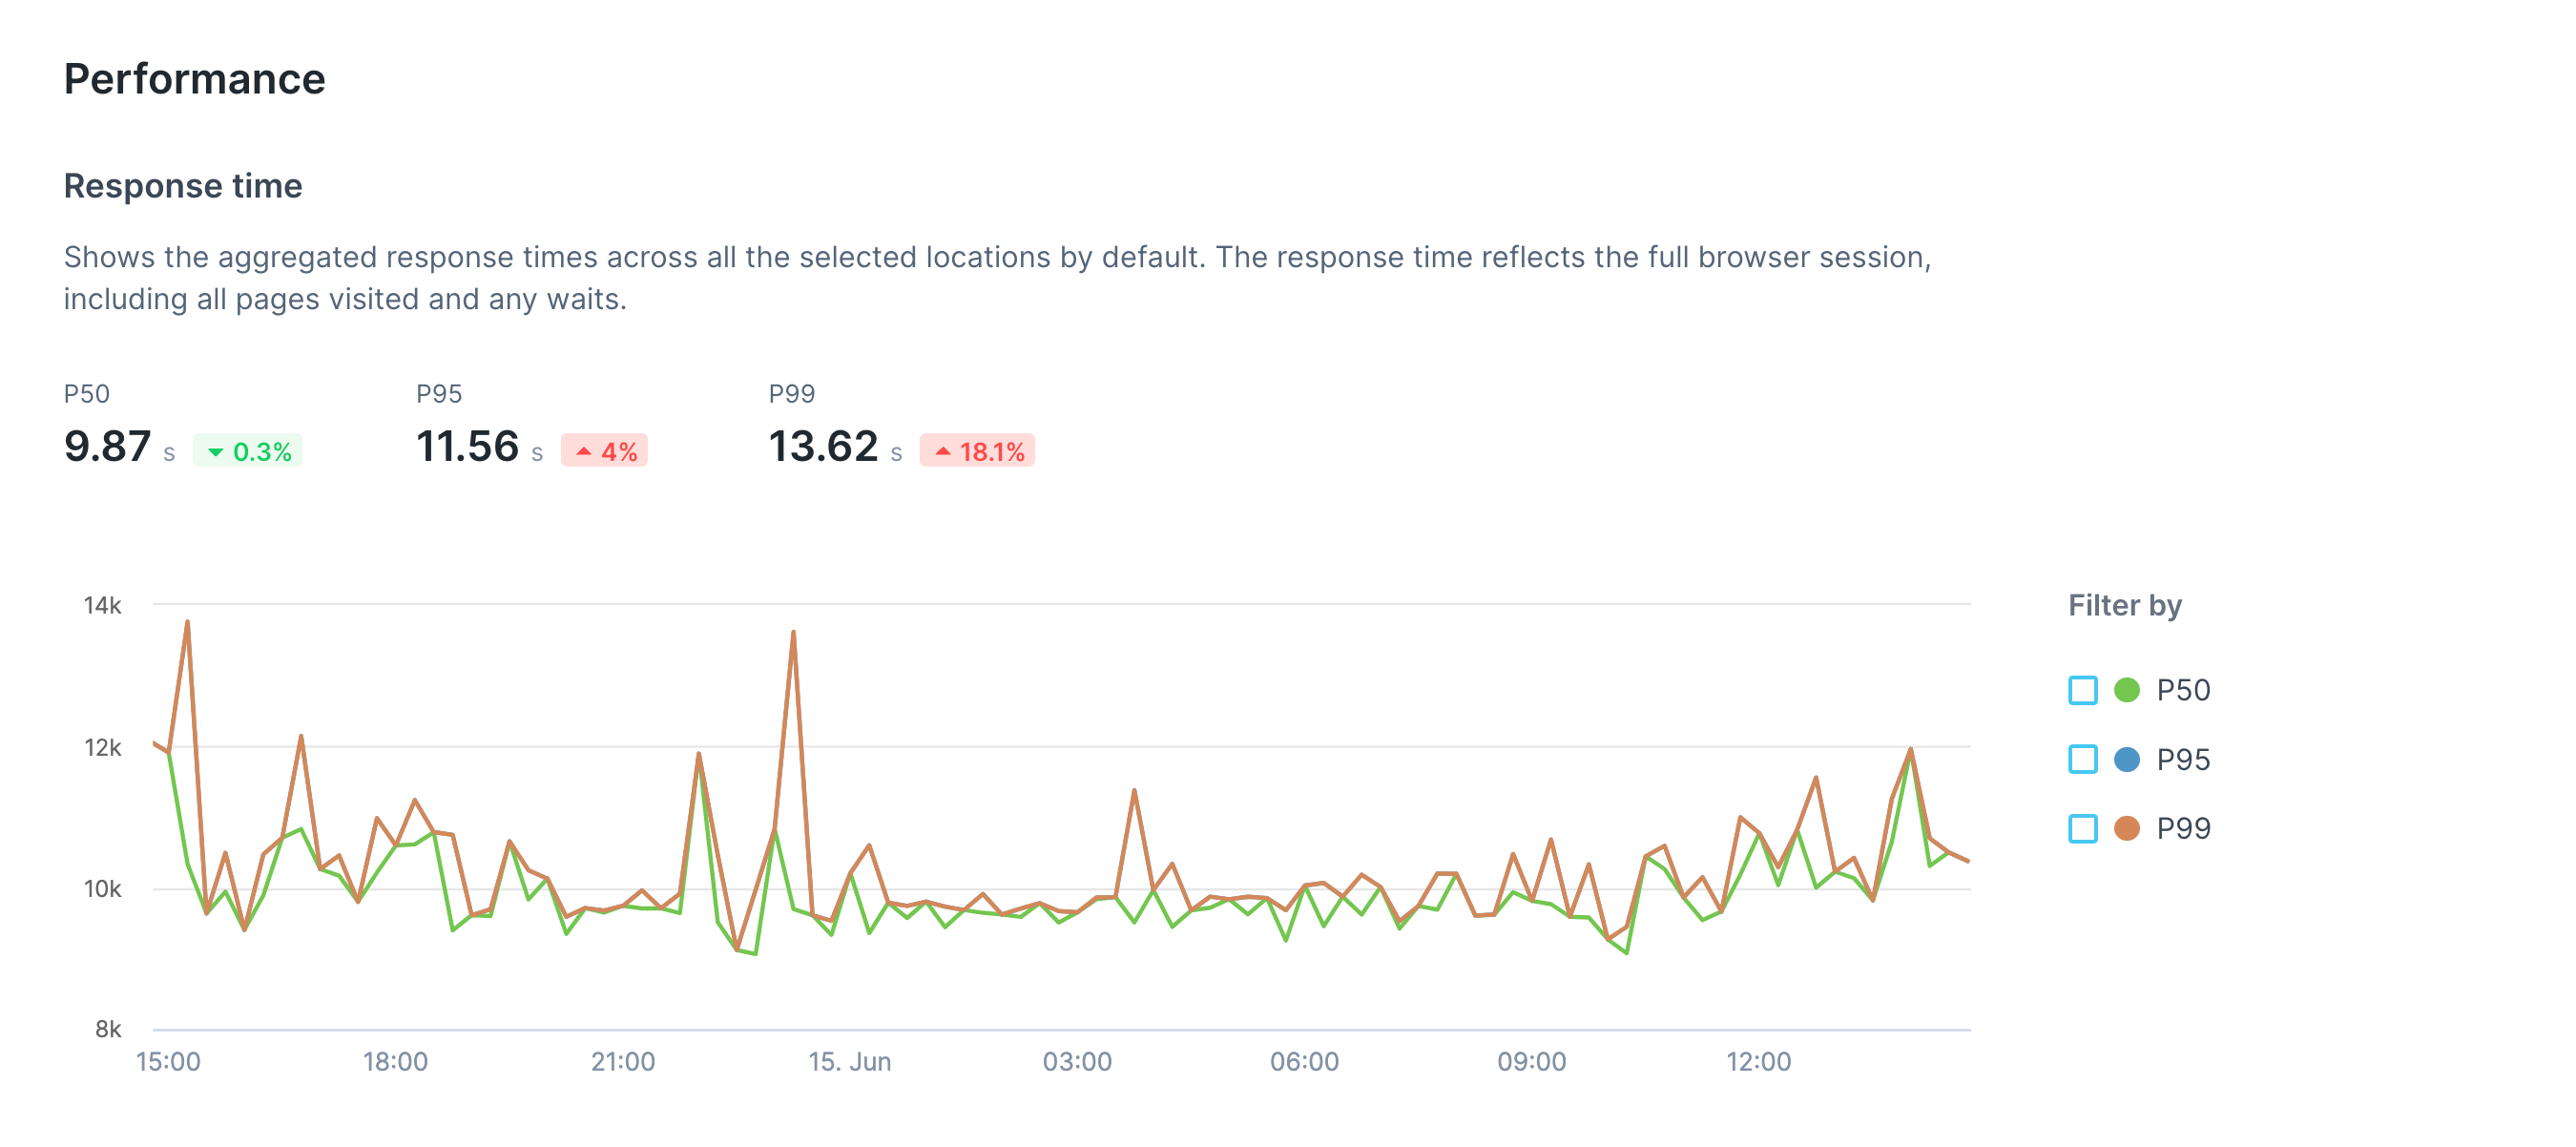
Depending on the type of check, different performance metrics will be shown in the Performance section.
For Browser checks, several performance metrics are shown in separate charts:
1. The total duration of the check run
When retries are enabled, an additional icon highlights that the check result contains multiple check runs.
### Monitoring results sidebar
On the right side you can view the check result broken down per check run and location for the selected time frame. If you select a bar in the monitoring results chart it will filter out the corresponding results in the sidebar. Click any result to navigate to the check results screen for detailed information about the check run.
### Performance
Depending on the type of check, different performance metrics will be shown in the Performance section.
For Browser checks, several performance metrics are shown in separate charts:
1. The total duration of the check run
 2. [Load timings](/browser-checks/tracing-web-vitals/#first-contentful-paint) for the first page navigation
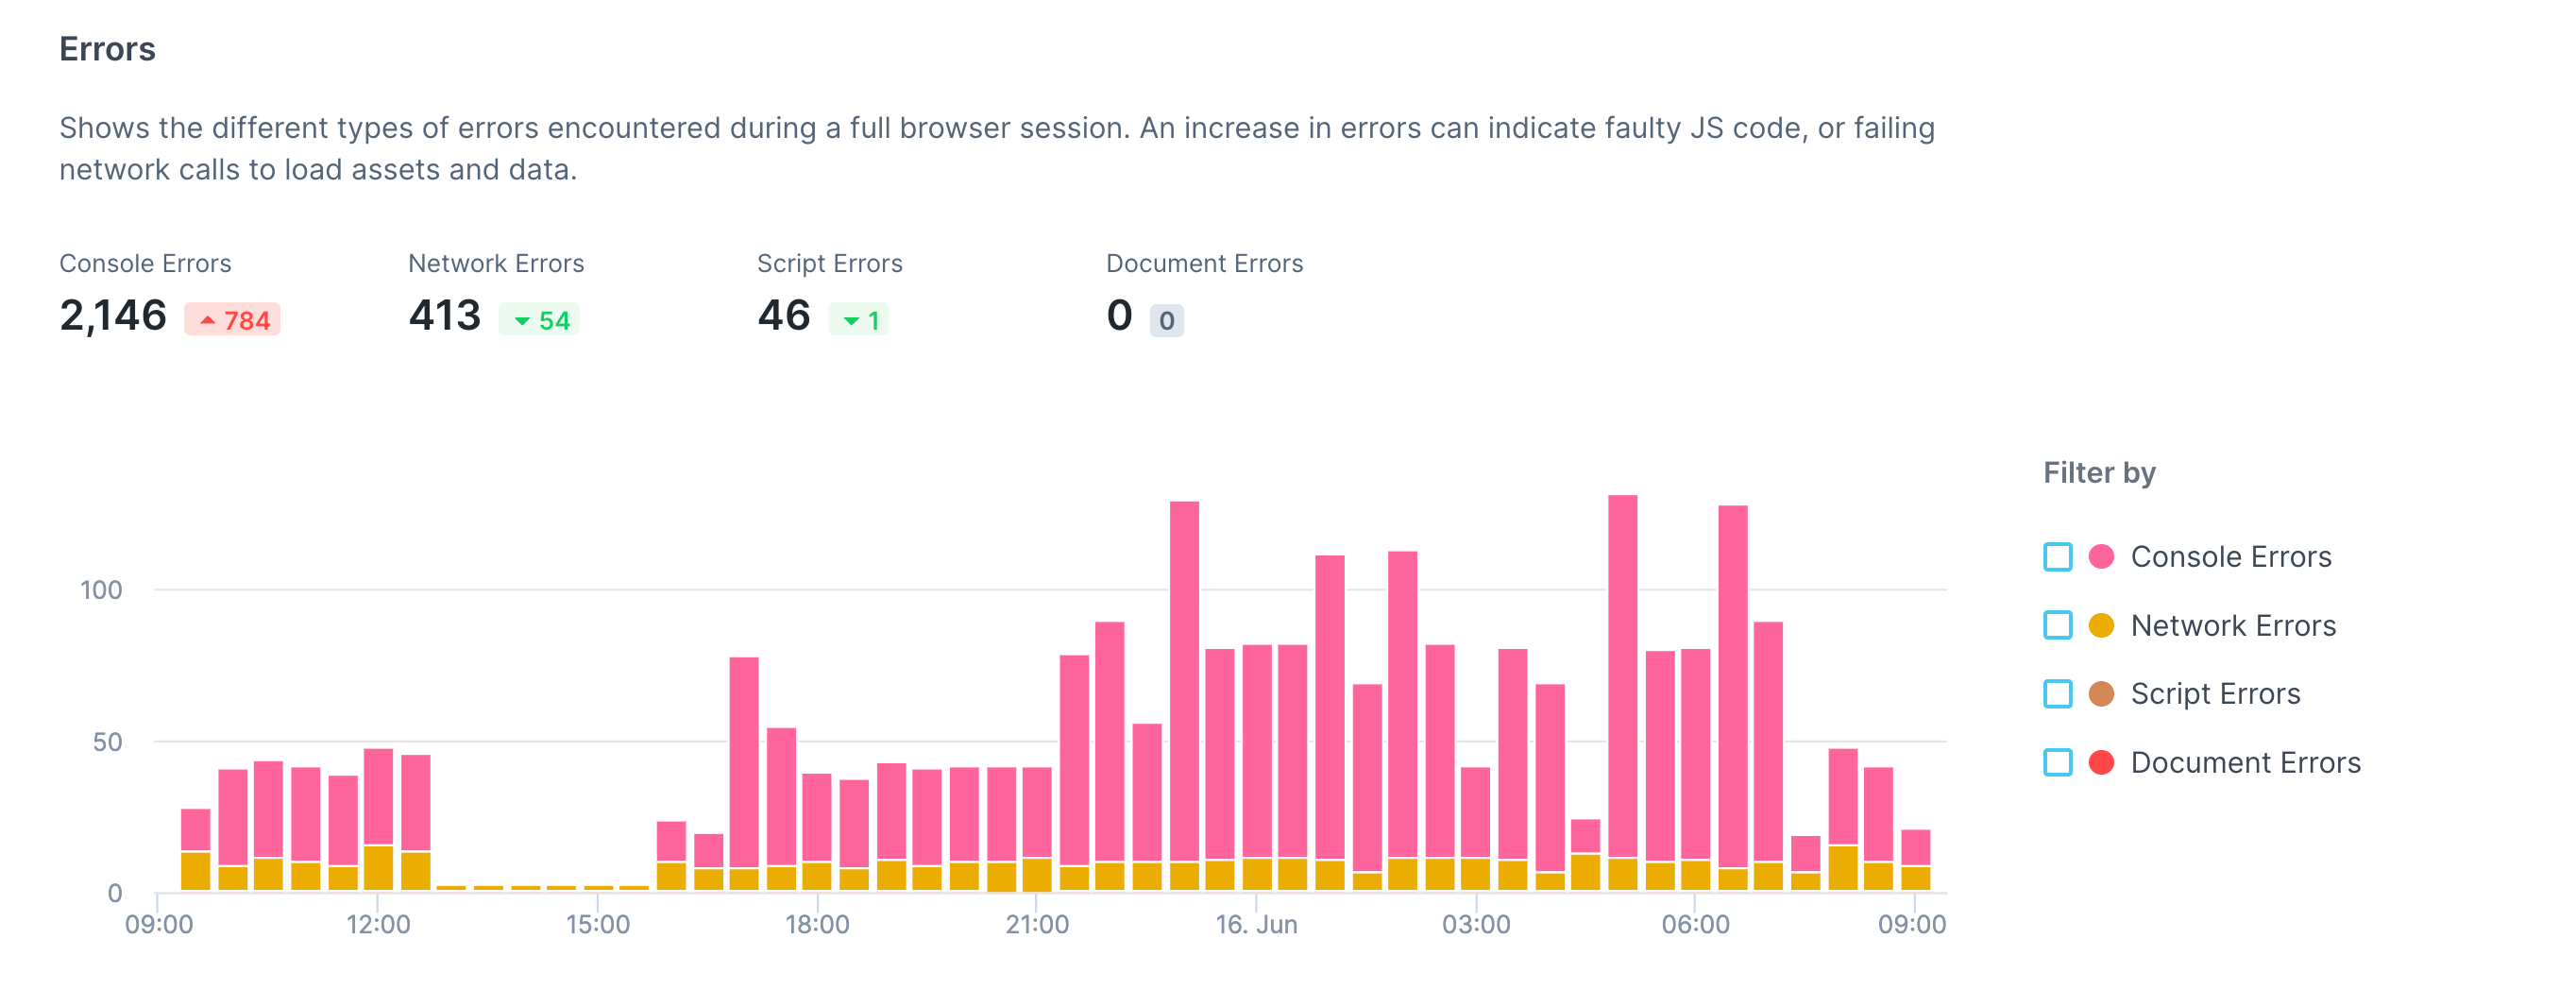
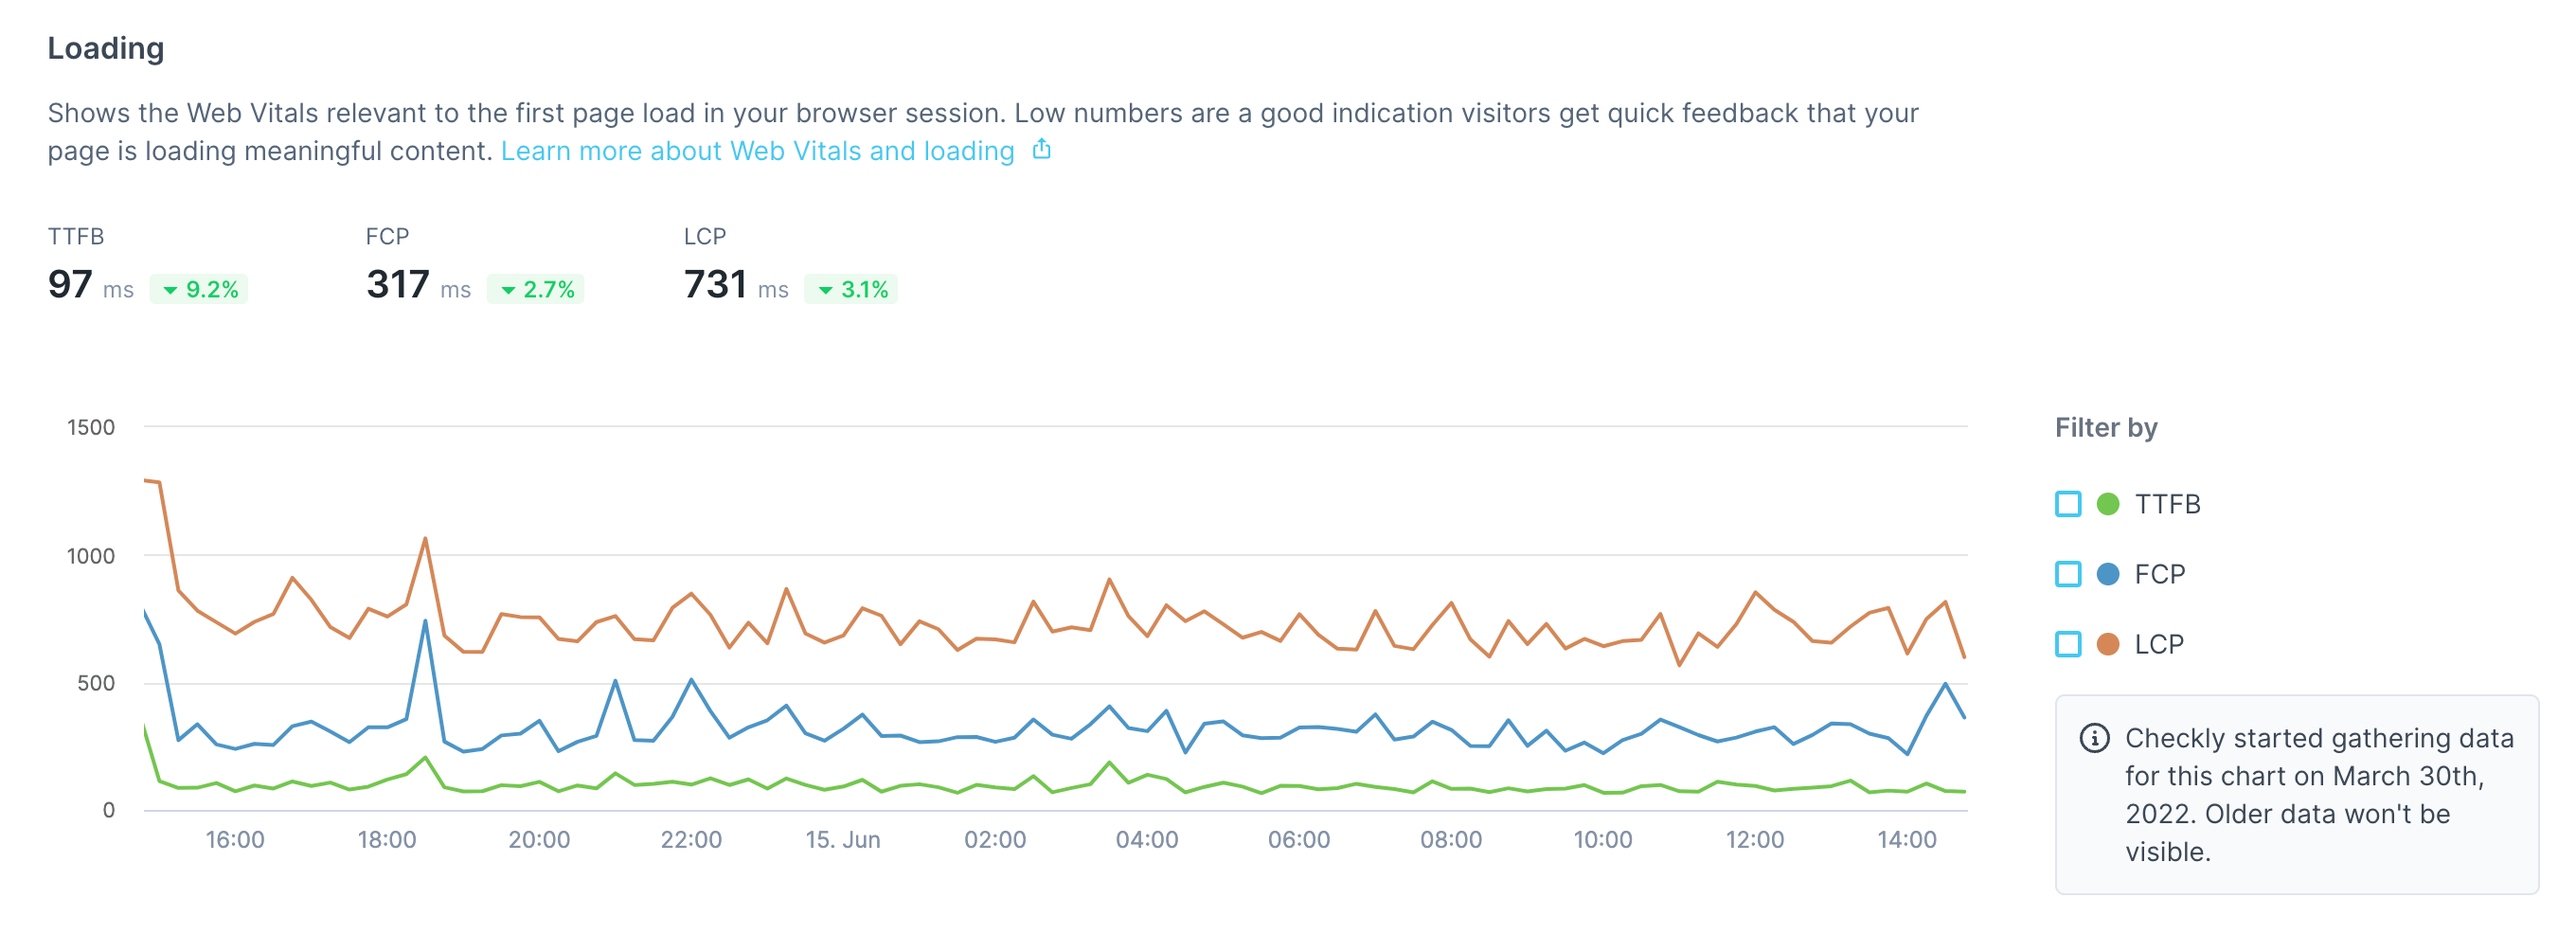 3. A breakdown of different error types
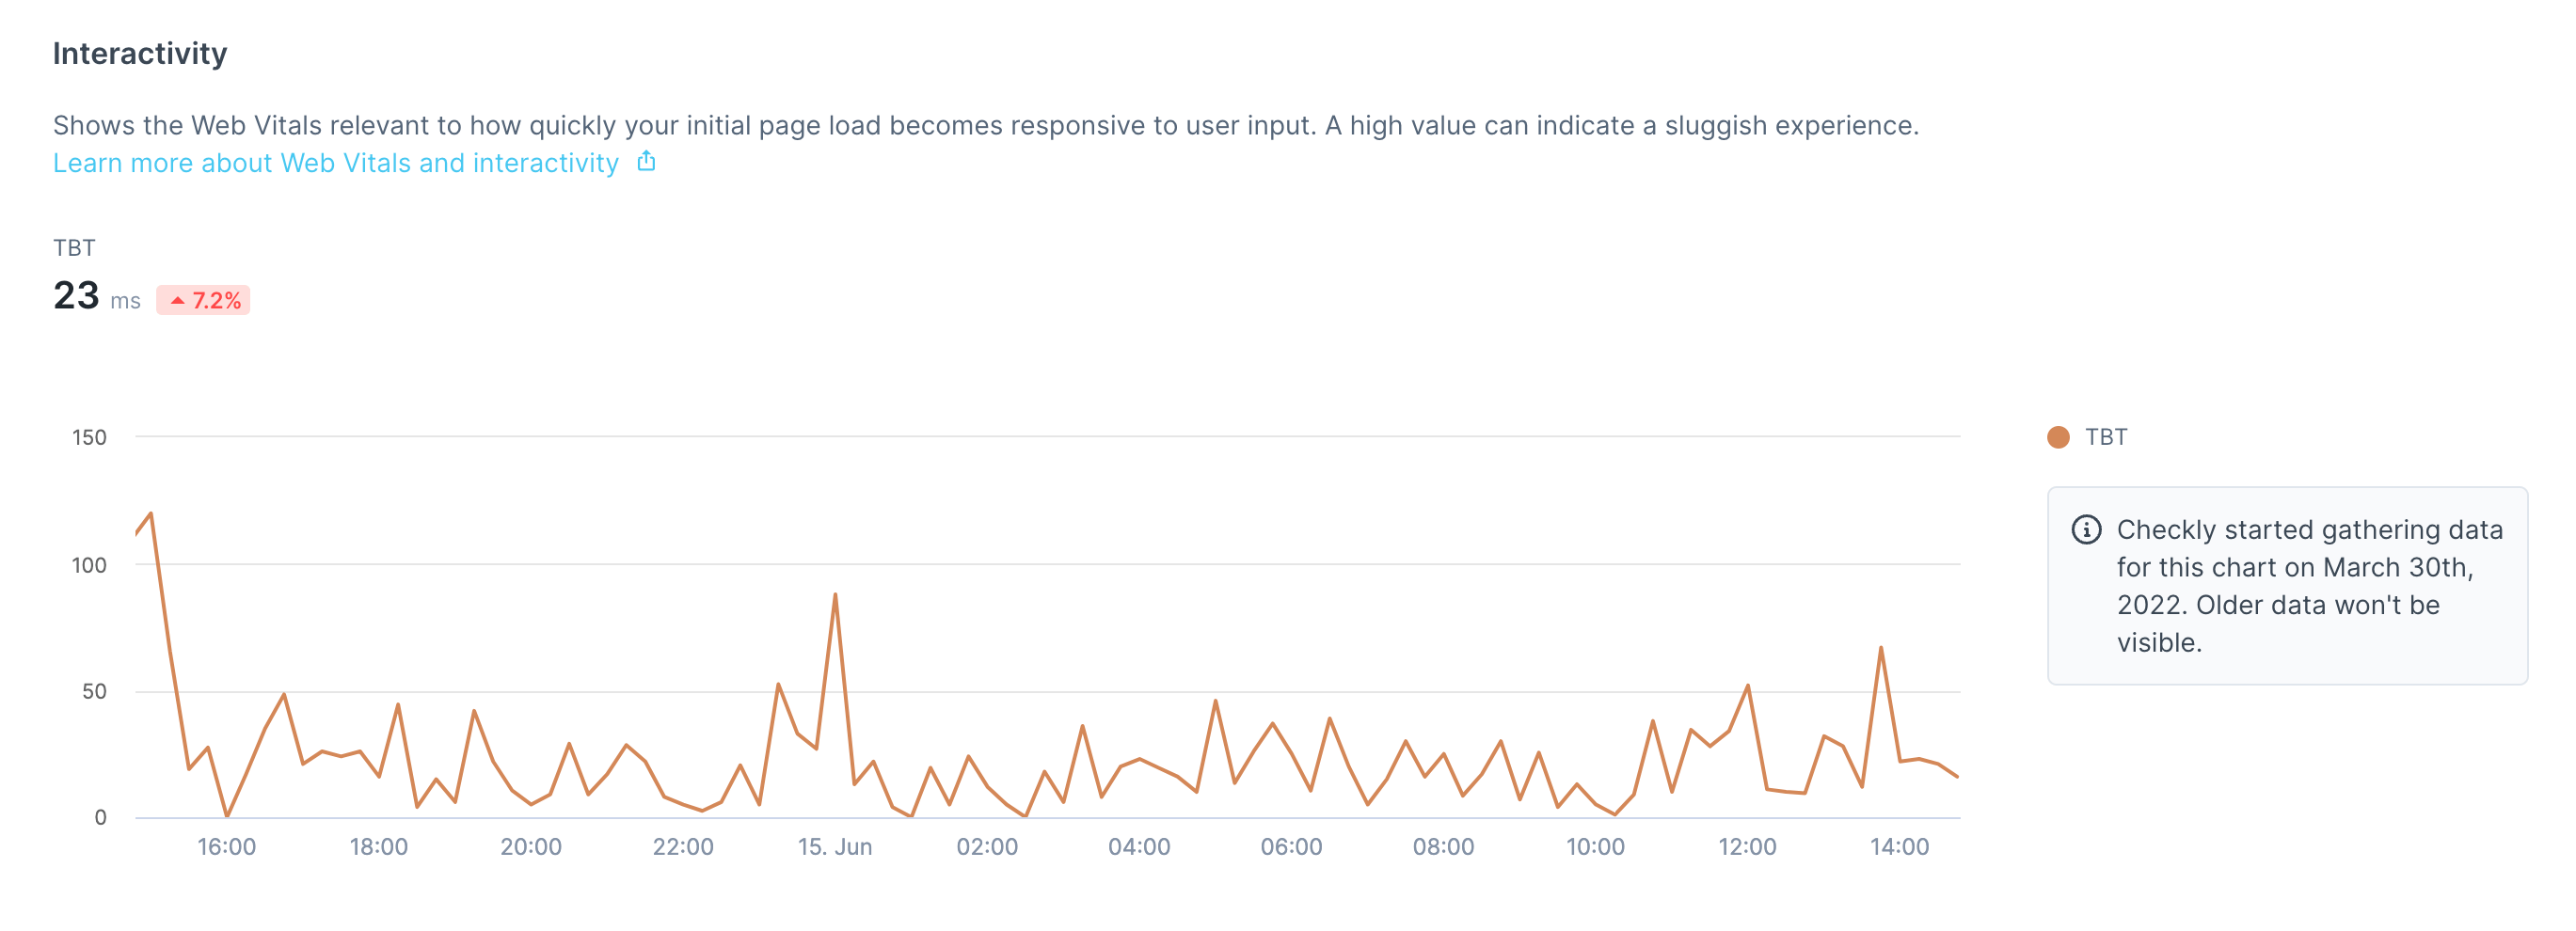
 4. An [interactivity](/browser-checks/tracing-web-vitals/#total-blocking-time) summary
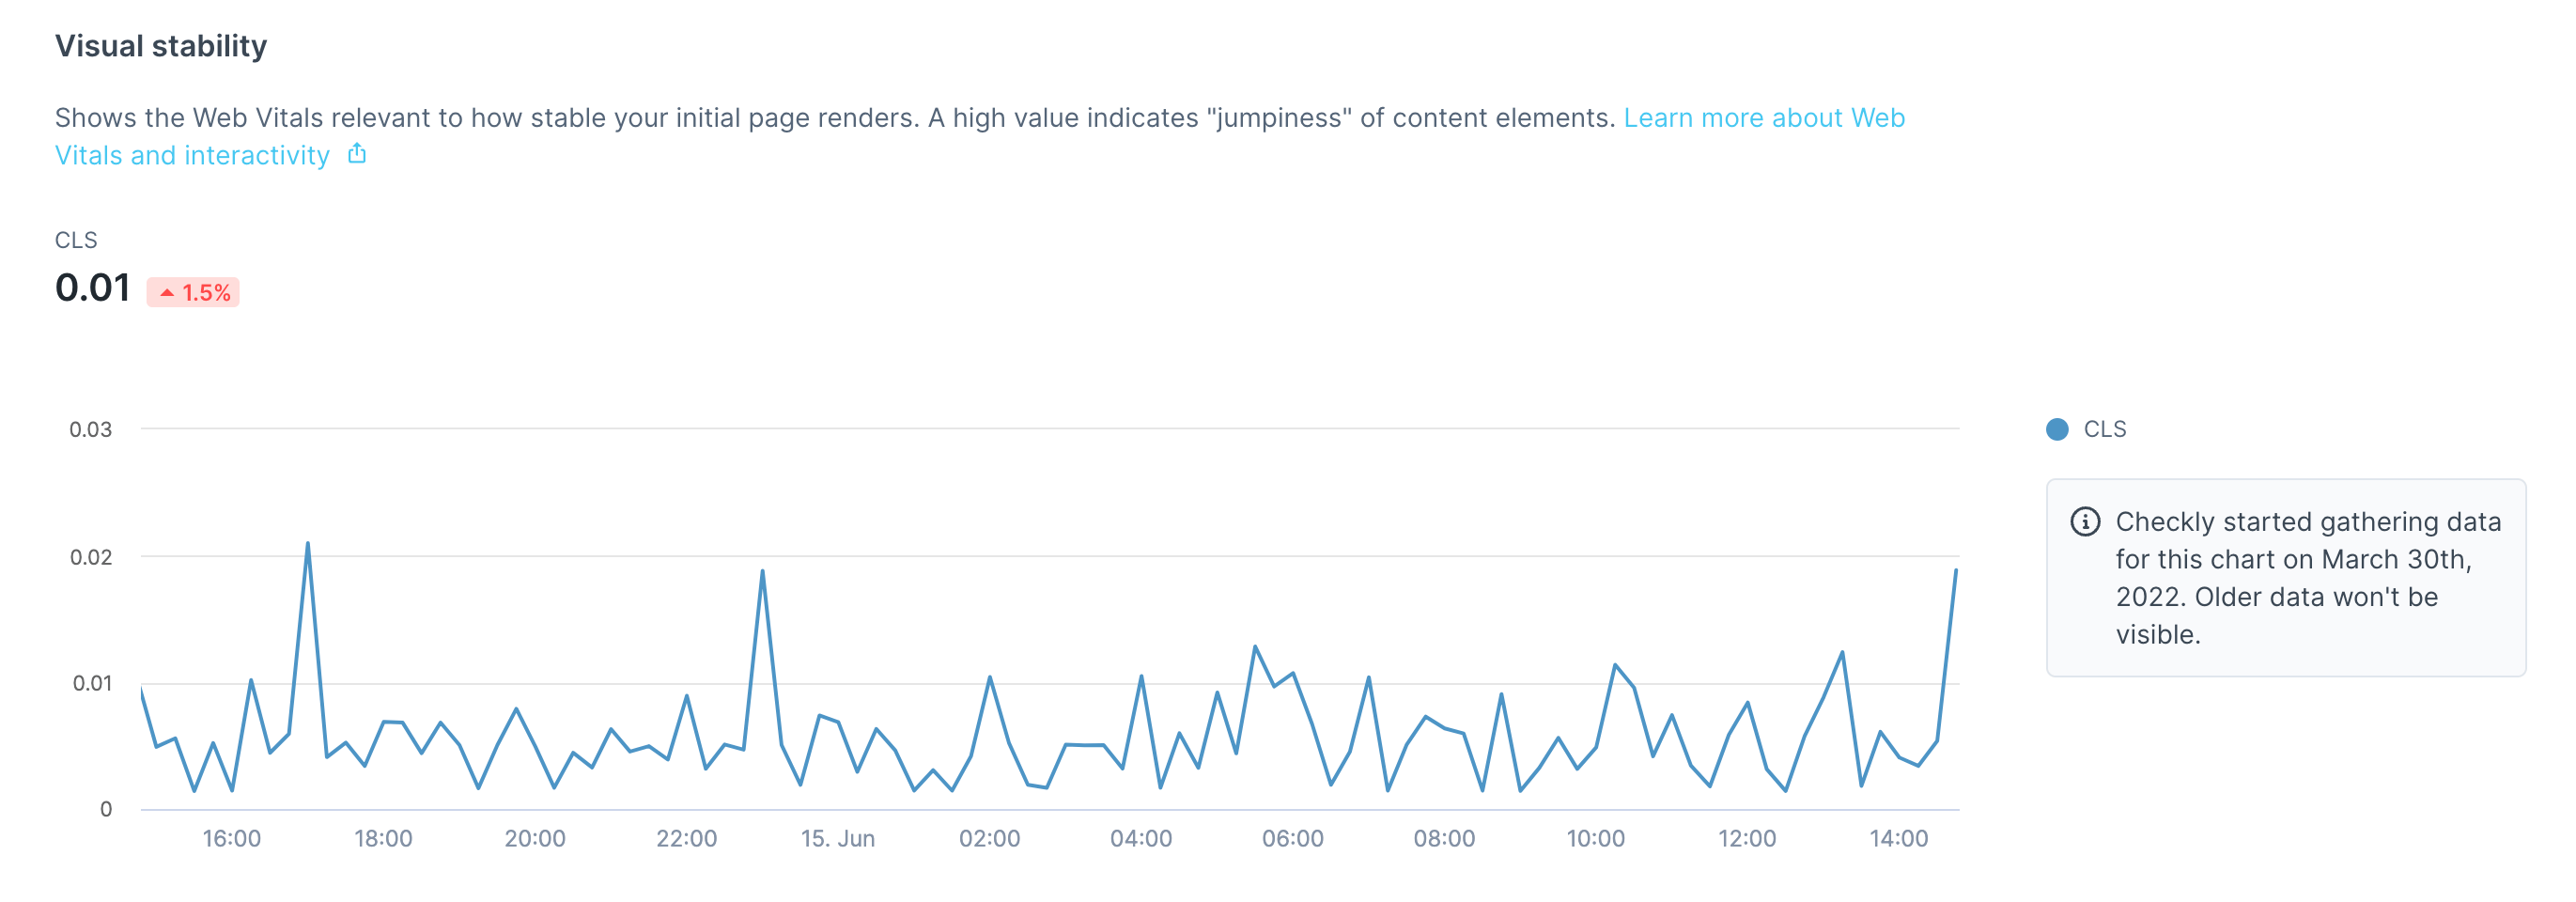
 5. A [visual stability](/browser-checks/tracing-web-vitals/#cumulative-layout-shift) breakdown
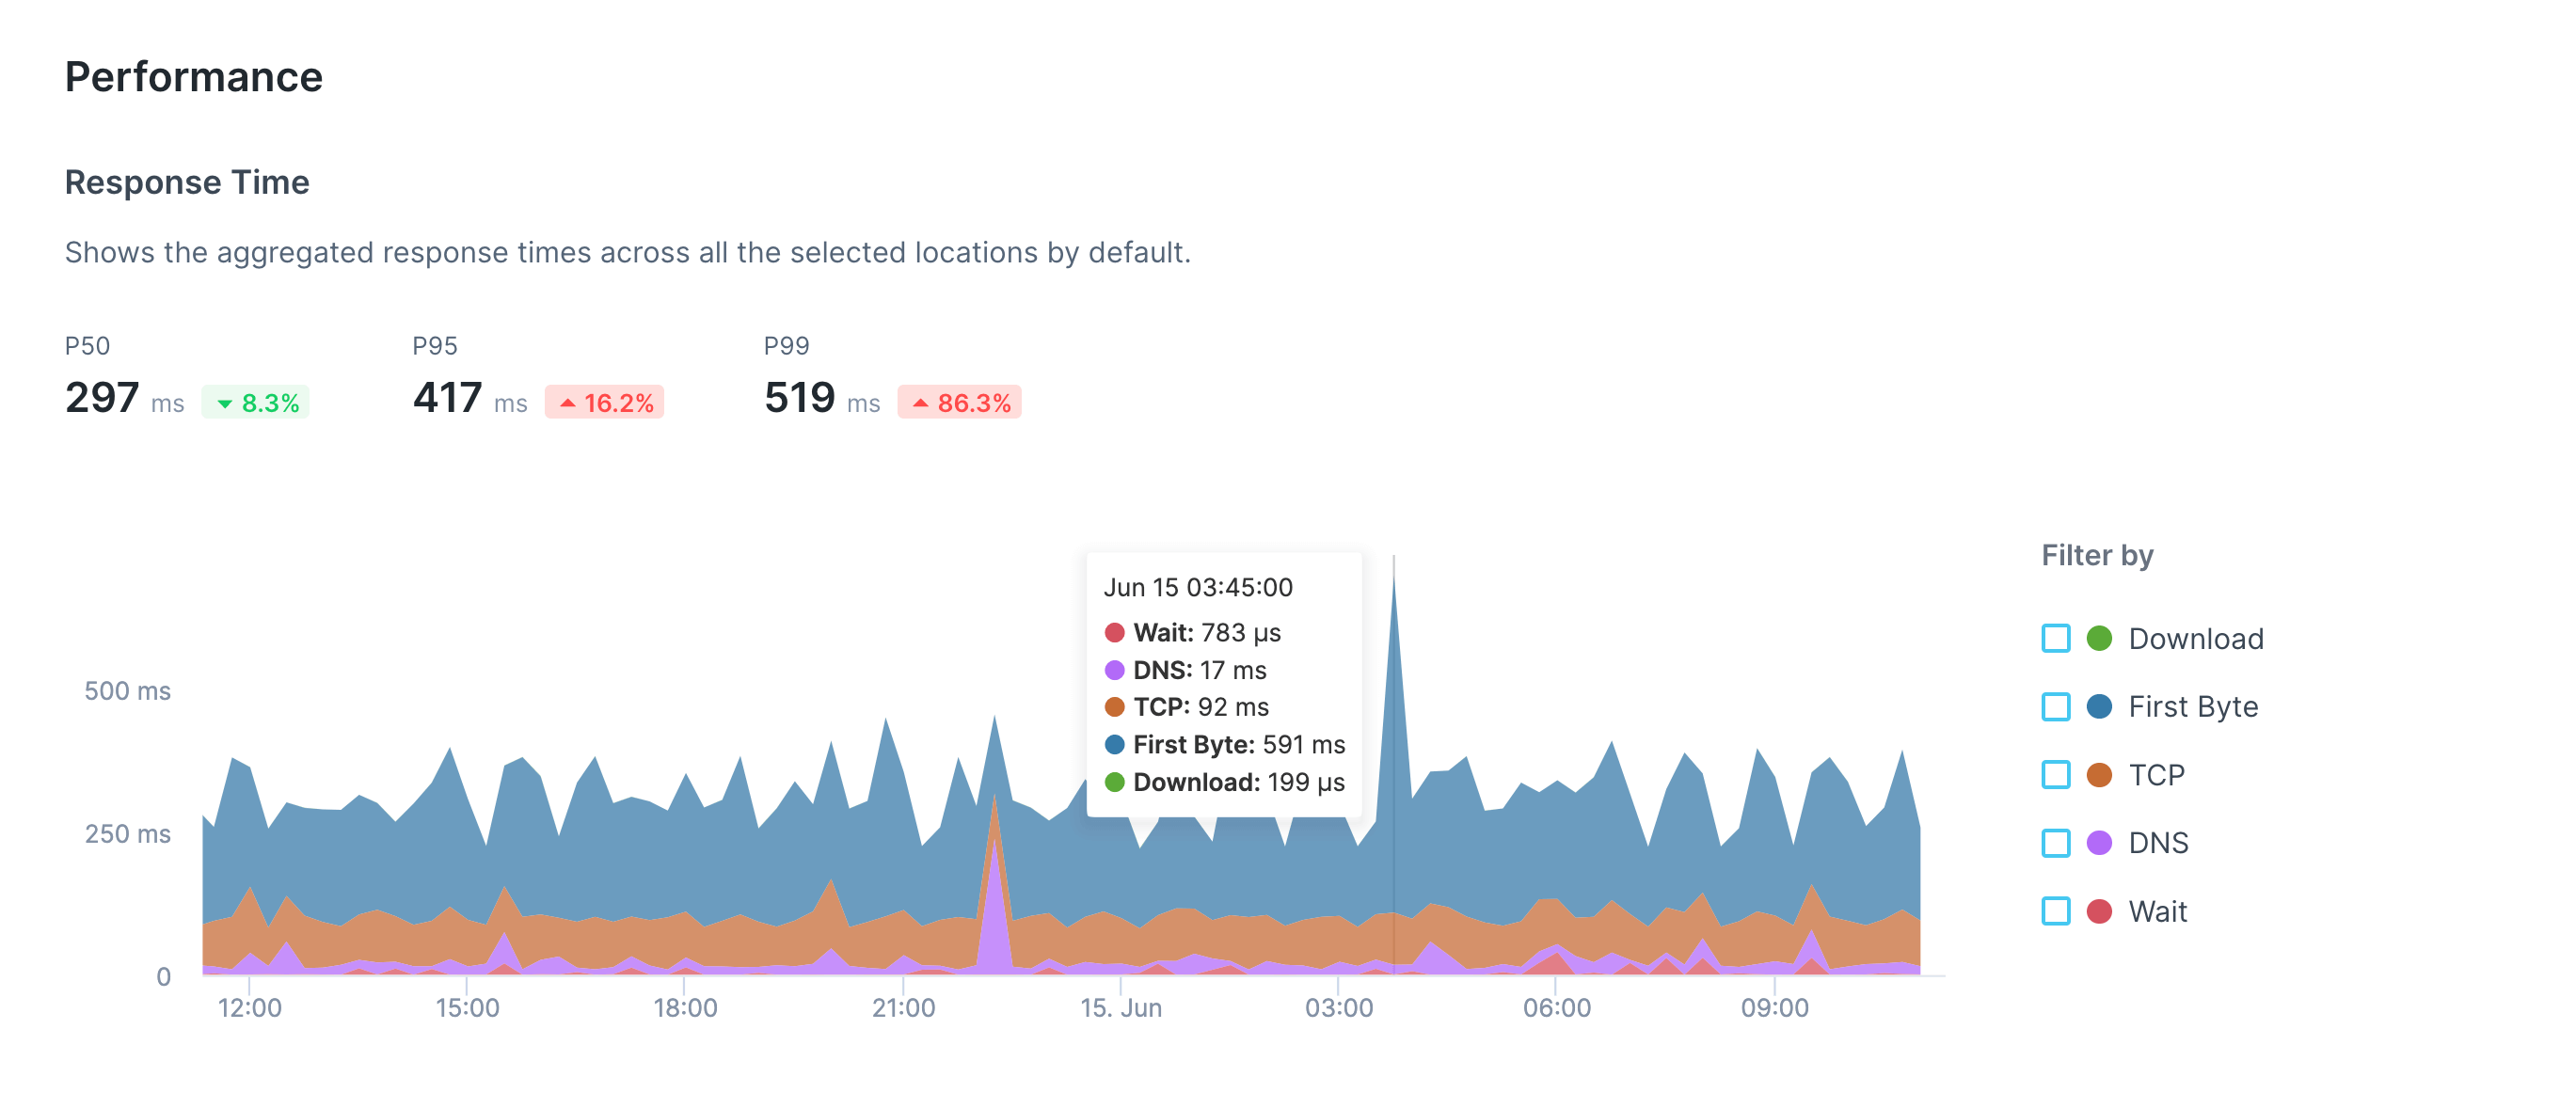
 For API checks, a detailed response time breakdown is shown:
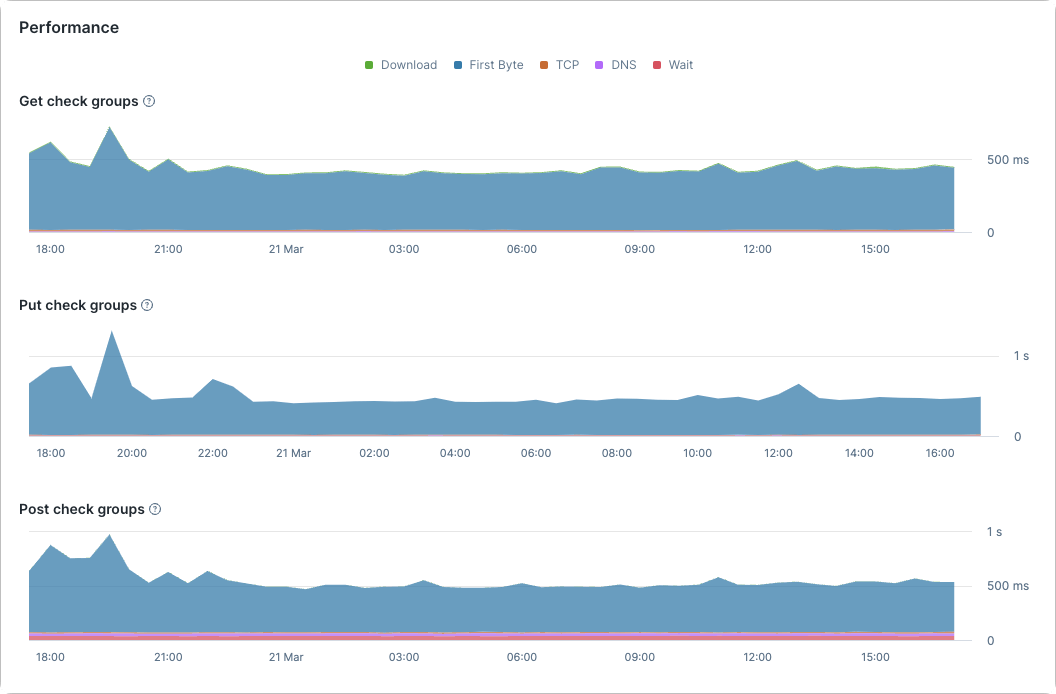
 For Multistep checks, a response time breakdown is shown per step:
 A performance comparison by location will also be included for both types of check:
 ## Navigating individual check results
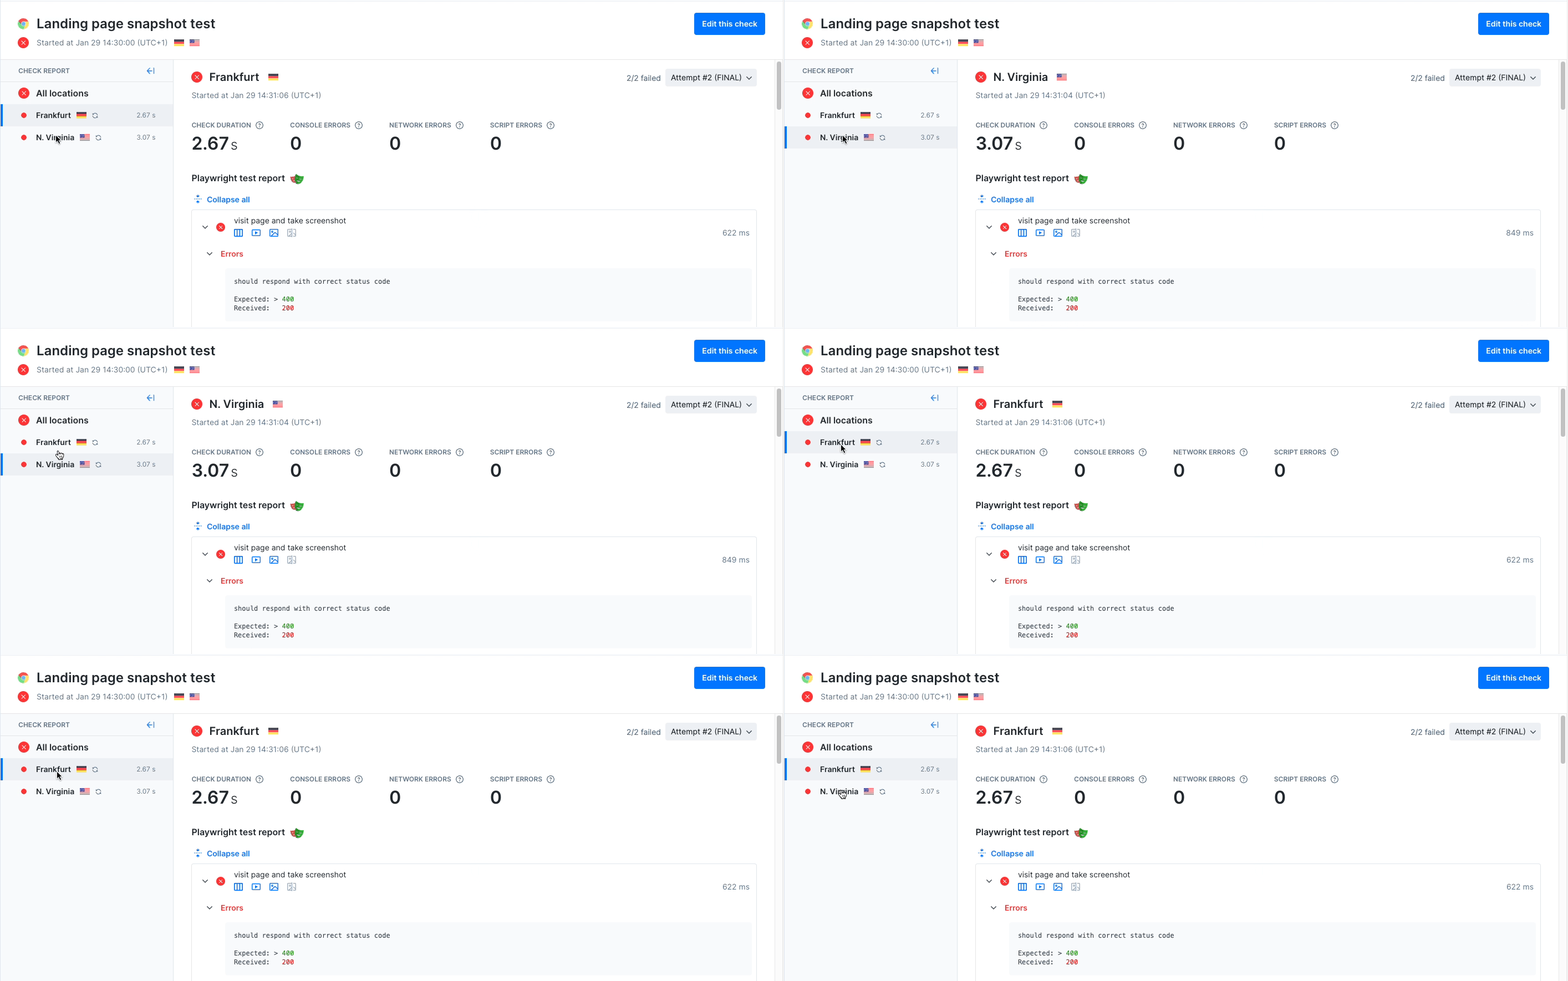
The check result page will contain results from multiple locations when using [parallel scheduling](/monitoring/global-locations/#scheduling-strategies). Navigate between each location using the sidebar.
## Navigating individual check results
The check result page will contain results from multiple locations when using [parallel scheduling](/monitoring/global-locations/#scheduling-strategies). Navigate between each location using the sidebar.
 ## Browser check results
Individual browser check results contain:
1. A short check summary, including errors broken down by category.
## Browser check results
Individual browser check results contain:
1. A short check summary, including errors broken down by category.
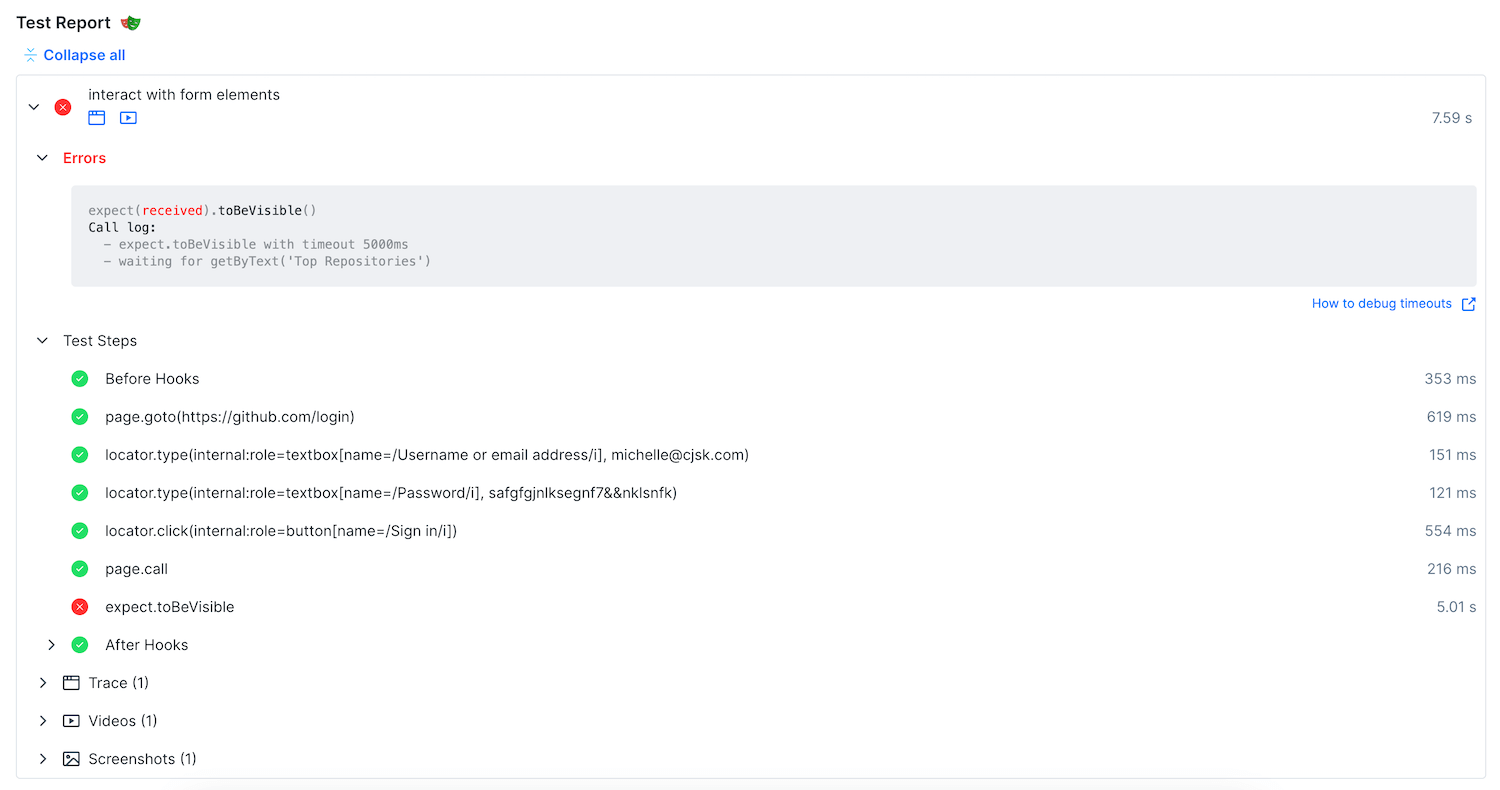
 2. When using Playwright Test Runner you will have an additional section displaying the test steps, error message, and assets (traces, videos, screenshots). [Read more](/browser-checks/playwright-test/) about the additonal functionalities of Playwright Test.
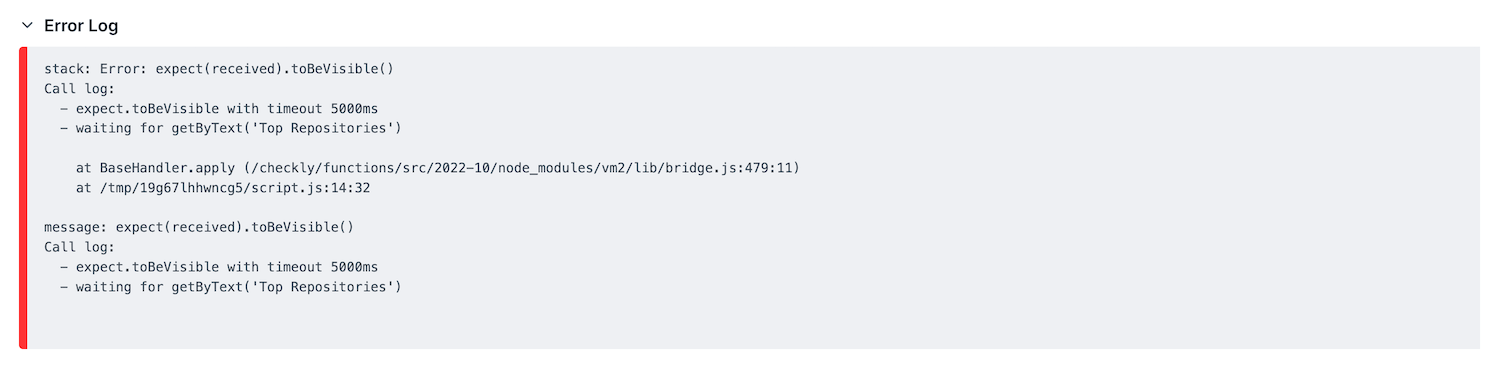
 3. An error log, only if your script failed.
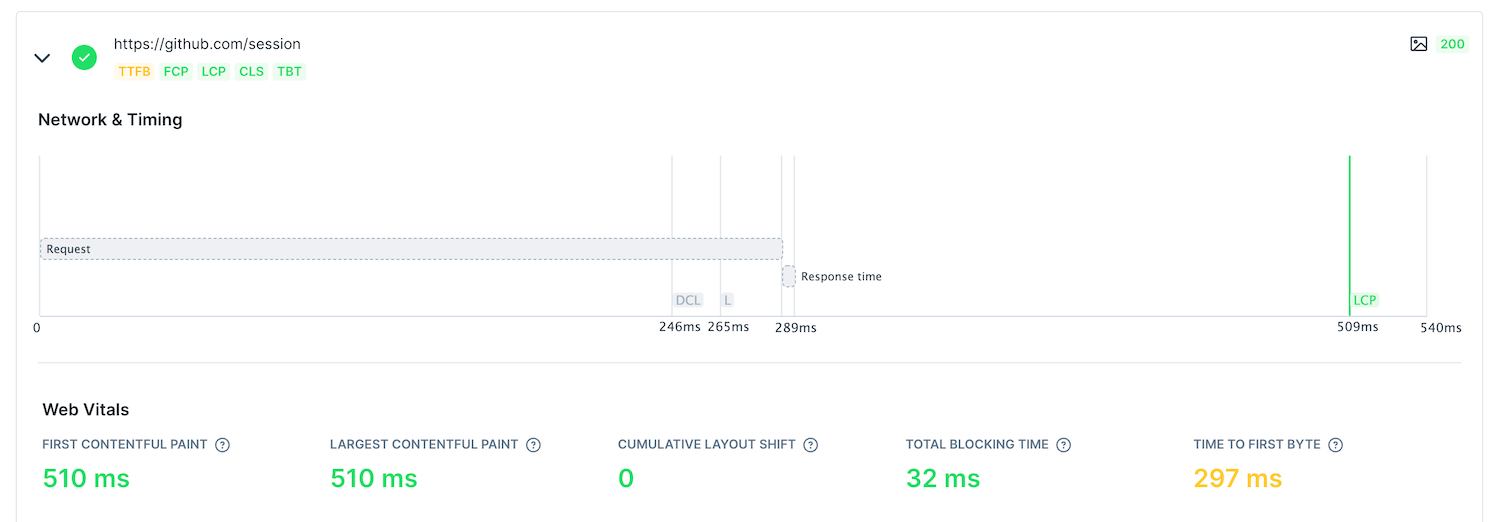
 4. Expandable tabs on page your script navigated to.
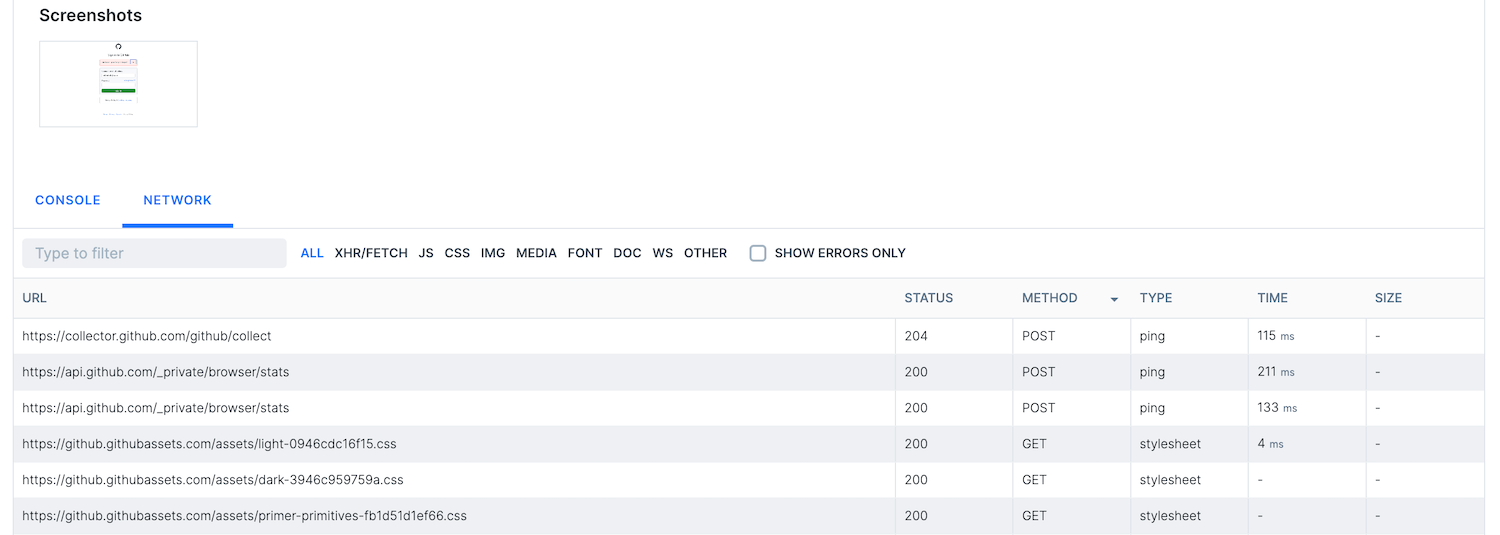
 When expanded, each tab shows its own navigation/loading time ribbon and web vitals...
 ...together with browser console logs, network logs and any screenshots that had been taken (including one screenshot taken automatically on failure).
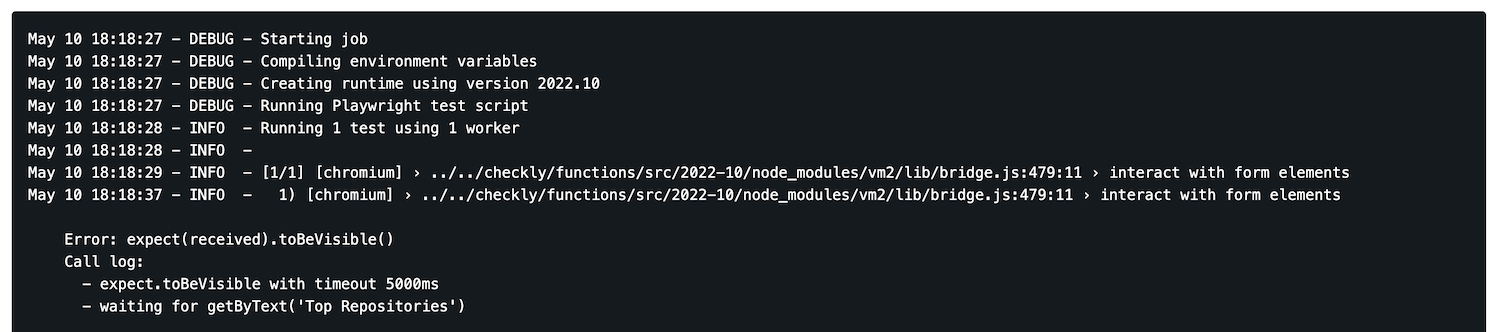
 5. A job log for the check.
 ## API check results
API check results will expose key performance and correctness data about the HTTP response received from the target endpoint.
## API check results
API check results will expose key performance and correctness data about the HTTP response received from the target endpoint.
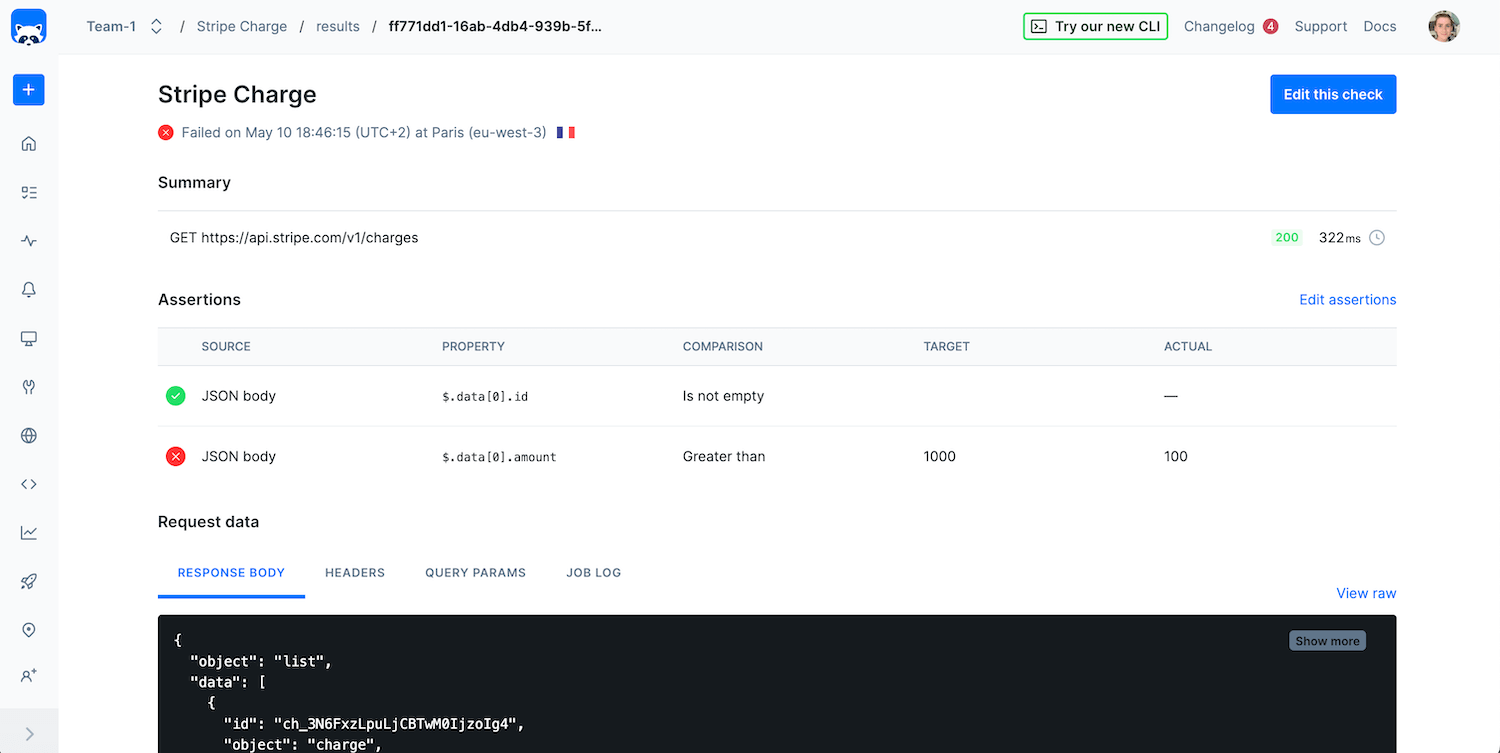 These include:
1. The request performed
2. Any assertions that were included in the check
3. All data related to the request and its response, such as
a. Response body
b. Request & response headers
c. Query params
d. Check job log
4. Timings, such as
a. Wait
b. DNS
c. TCP
d. First Byte
e. Download
## Heartbeat monitor results
Heartbeat monitor results show information about the ping request, like when it was recieved and its source.
These include:
1. The request performed
2. Any assertions that were included in the check
3. All data related to the request and its response, such as
a. Response body
b. Request & response headers
c. Query params
d. Check job log
4. Timings, such as
a. Wait
b. DNS
c. TCP
d. First Byte
e. Download
## Heartbeat monitor results
Heartbeat monitor results show information about the ping request, like when it was recieved and its source.
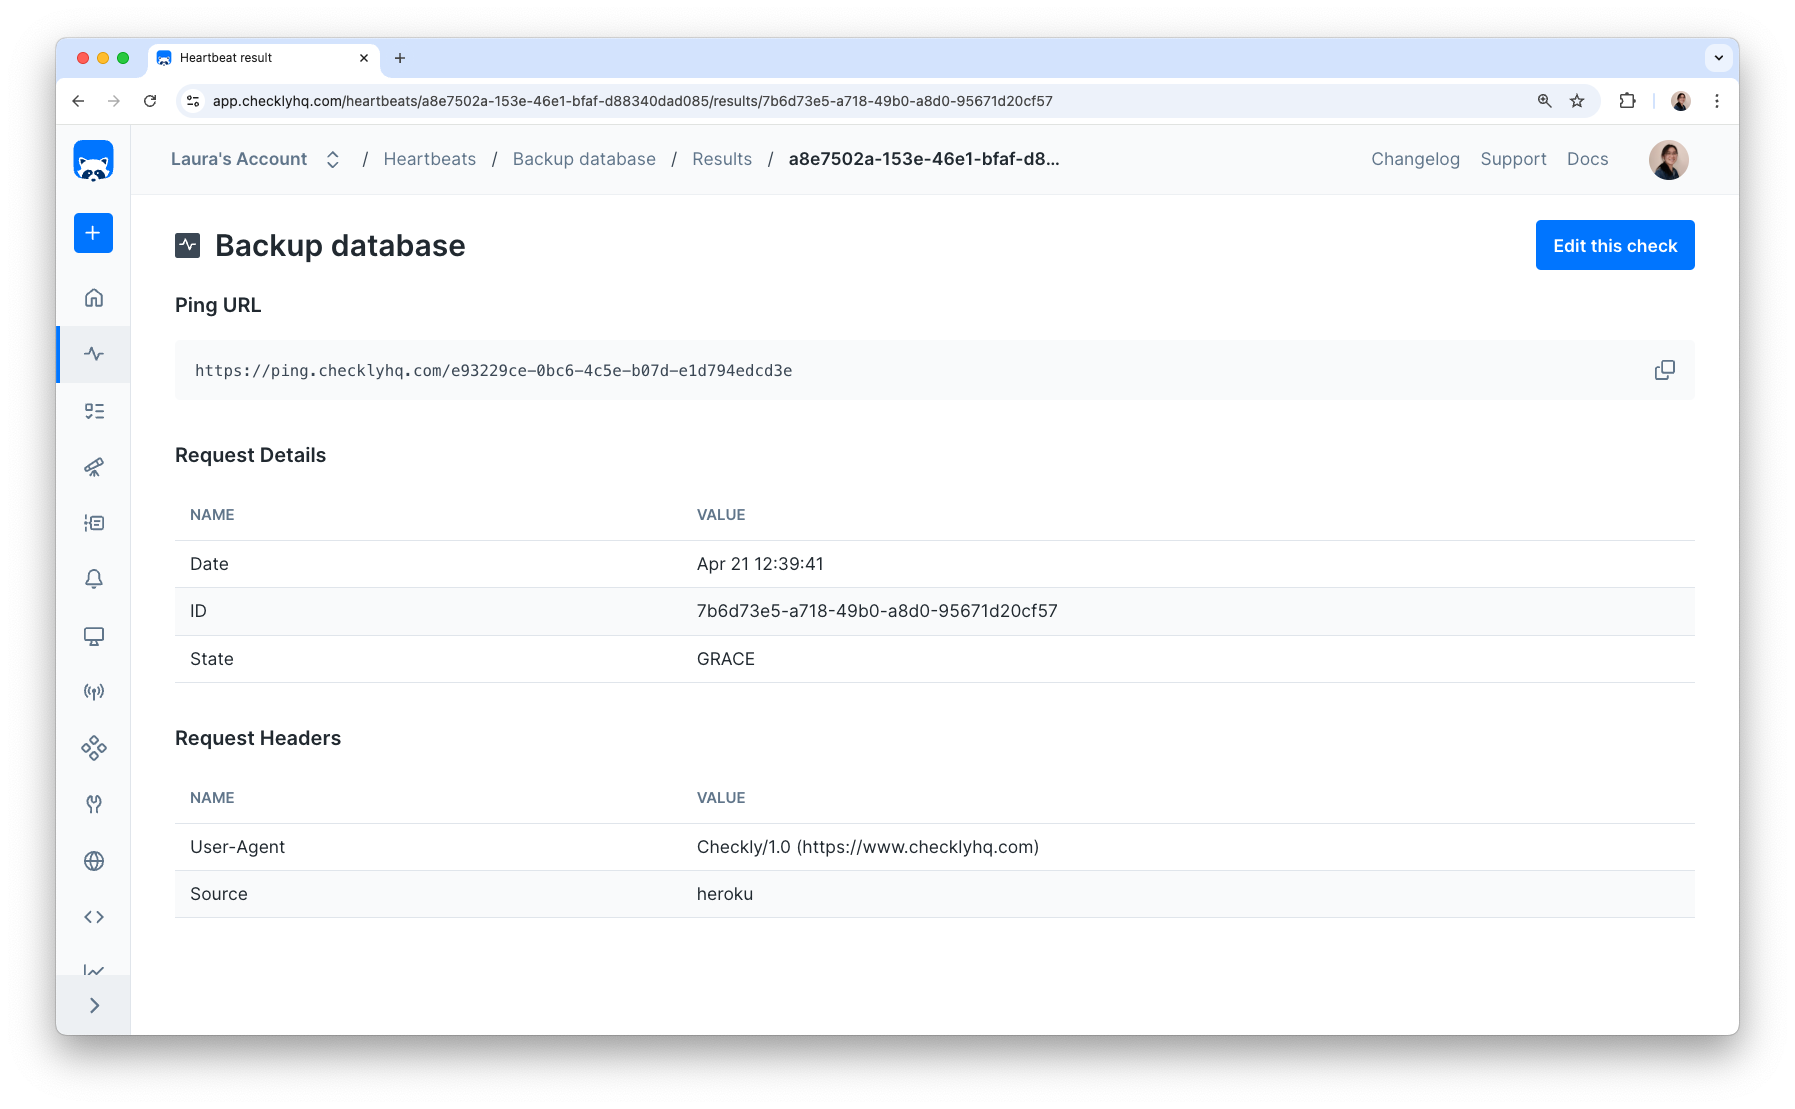 The state indicates when your scheduled job pinged the Heartbeat monitor, relative to the expected time:
| State | Description |
| ---------- | ---------------------------------------------------------------------------------------------------------------------------------------- |
| `EARLY` | Ping recieved before the expected time. |
| `RECEIVED` | Ping recieved right at the expected time. |
| `GRACE` | Ping recieved after the expected time, during the grace period. |
| `LATE` | Ping recieved during the few seconds between the end of the grace period and before the monitor is marked as failing. This is very rare. |
| `FAILING` | No ping recieved by the end of the grace period. Indicates a failing Heartbeat monitor. |
The source shows where your ping originated, determined by the `origin` and `referer` request headers. [Learn more about configuring the ping source](/heartbeat-monitors/#pinging-your-heartbeat-monitor).
## URL monitor results
URL monitor results show details about each request and help you understand if your endpoint was available and performing as expected at the time of the check.
The state indicates when your scheduled job pinged the Heartbeat monitor, relative to the expected time:
| State | Description |
| ---------- | ---------------------------------------------------------------------------------------------------------------------------------------- |
| `EARLY` | Ping recieved before the expected time. |
| `RECEIVED` | Ping recieved right at the expected time. |
| `GRACE` | Ping recieved after the expected time, during the grace period. |
| `LATE` | Ping recieved during the few seconds between the end of the grace period and before the monitor is marked as failing. This is very rare. |
| `FAILING` | No ping recieved by the end of the grace period. Indicates a failing Heartbeat monitor. |
The source shows where your ping originated, determined by the `origin` and `referer` request headers. [Learn more about configuring the ping source](/heartbeat-monitors/#pinging-your-heartbeat-monitor).
## URL monitor results
URL monitor results show details about each request and help you understand if your endpoint was available and performing as expected at the time of the check.
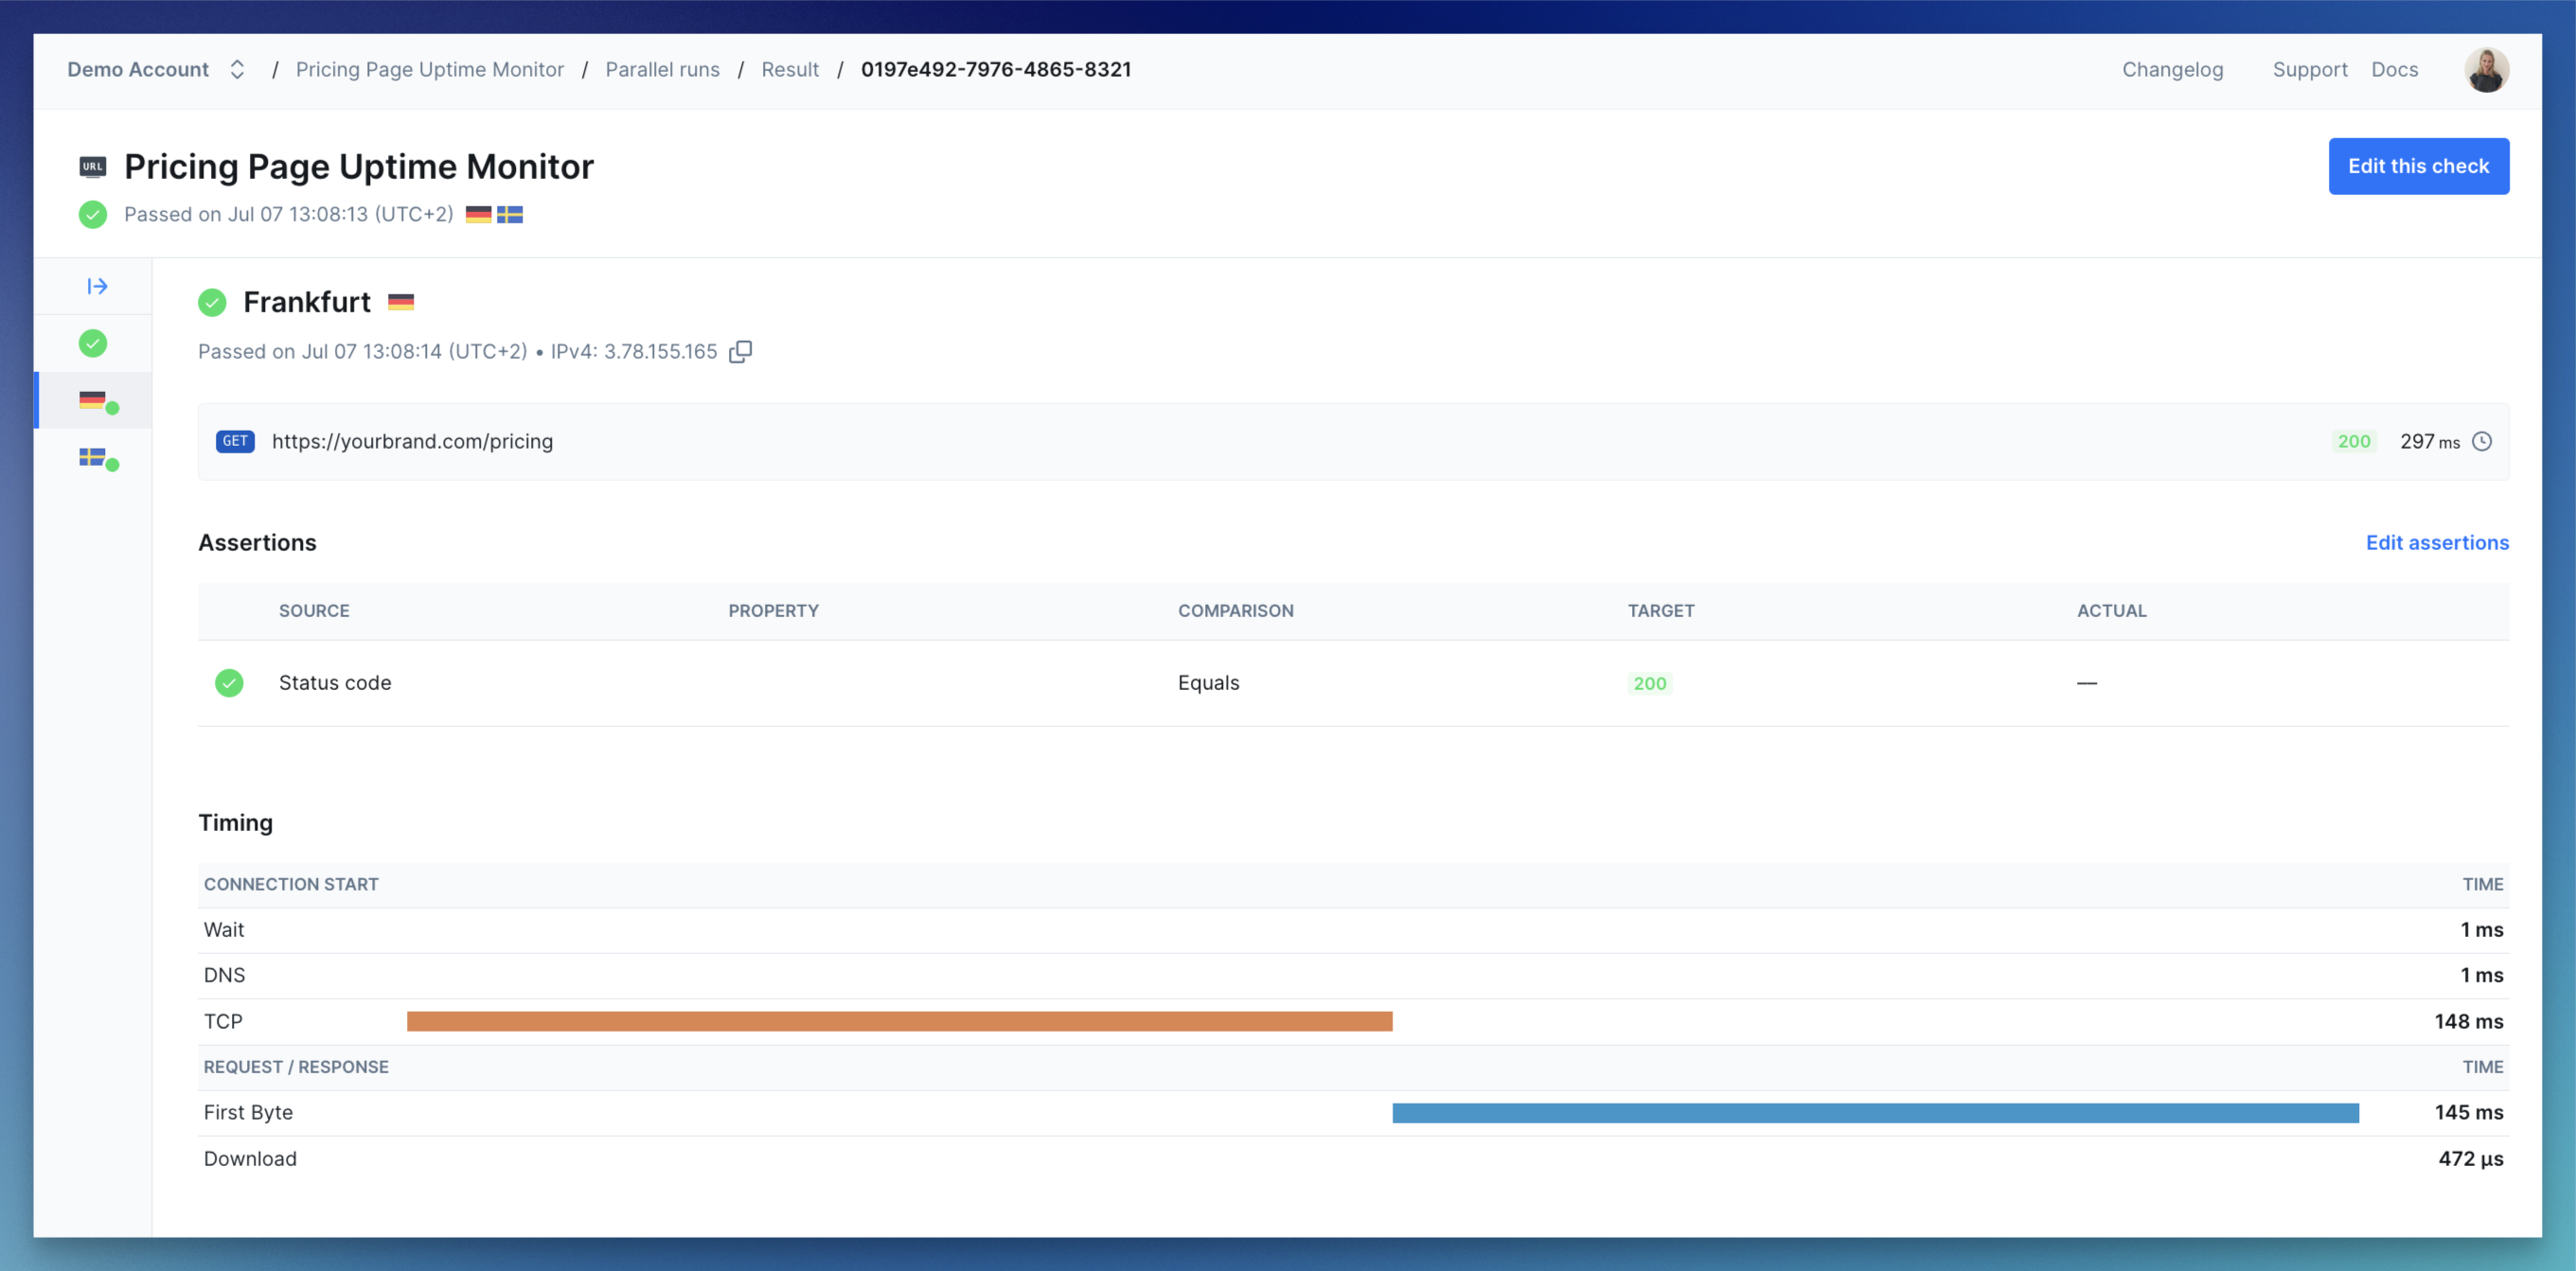 Each result includes:
1. The HTTP request that was made
2. The response time
3. The result of any status code assertions configured in the monitor
4. For each request, we capture the following timing metrics:
* wait: time spent initializing the socket
* dns: DNS lookup time
* tcp: time to establish the TCP connection
* firstByte: time until the first byte of the response is received
* download: duration of the HTTP download
## Multistep check results
Multistep check results are navigated using the tree on the left side of the screen. If you are running checks in parallel, first select the location you are interested in.
In the result tree, the top node shows the check run log and the check run configuration.
Any errors encountered can be viewed in the 'Errors' node.
Each Playwright request is shown as a separate node under the test step in which it was performed. Selecting a request node opens the request details. Here you can view the request and response body, headers and any request parameters. A breakdown of the request timings is also available. If you've made assertions in the same test step as this request, then those assertions will be shown here.
The default request user-agent is `Checkly/1.0 (https://www.checklyhq.com)`.
If you would like to use a different user-agent, you can add `test.use({userAgent: 'customUserAgent'})` to your script.
Currently, only requests done using the Playwright `request` are shown as nodes in the tree, requests done via e.g Axios or HTTPS are not.
## TCP monitor results
On the [monitor results overview page](/images/docs/monitoring/check-results/#check-results-overview), select a specific check run to review its results:
* **Summary:** Displays the monitor target (URL and port), the monitor state (`success` for passed and degraded runs, or `error` for failed runs), the request status code and the total check run duration.
* **Error details:** If the check failed, the error status code and message log will be shown.
* **Timing phases:** For each request, we capture the following timing metrics:
* DNS: Time taken to resolve the hostname to an IP address (if a hostname was provided)
* Connect: Time taken to establish the TCP connection (SYN, SYN-ACK, ACK)
## Check results with retries
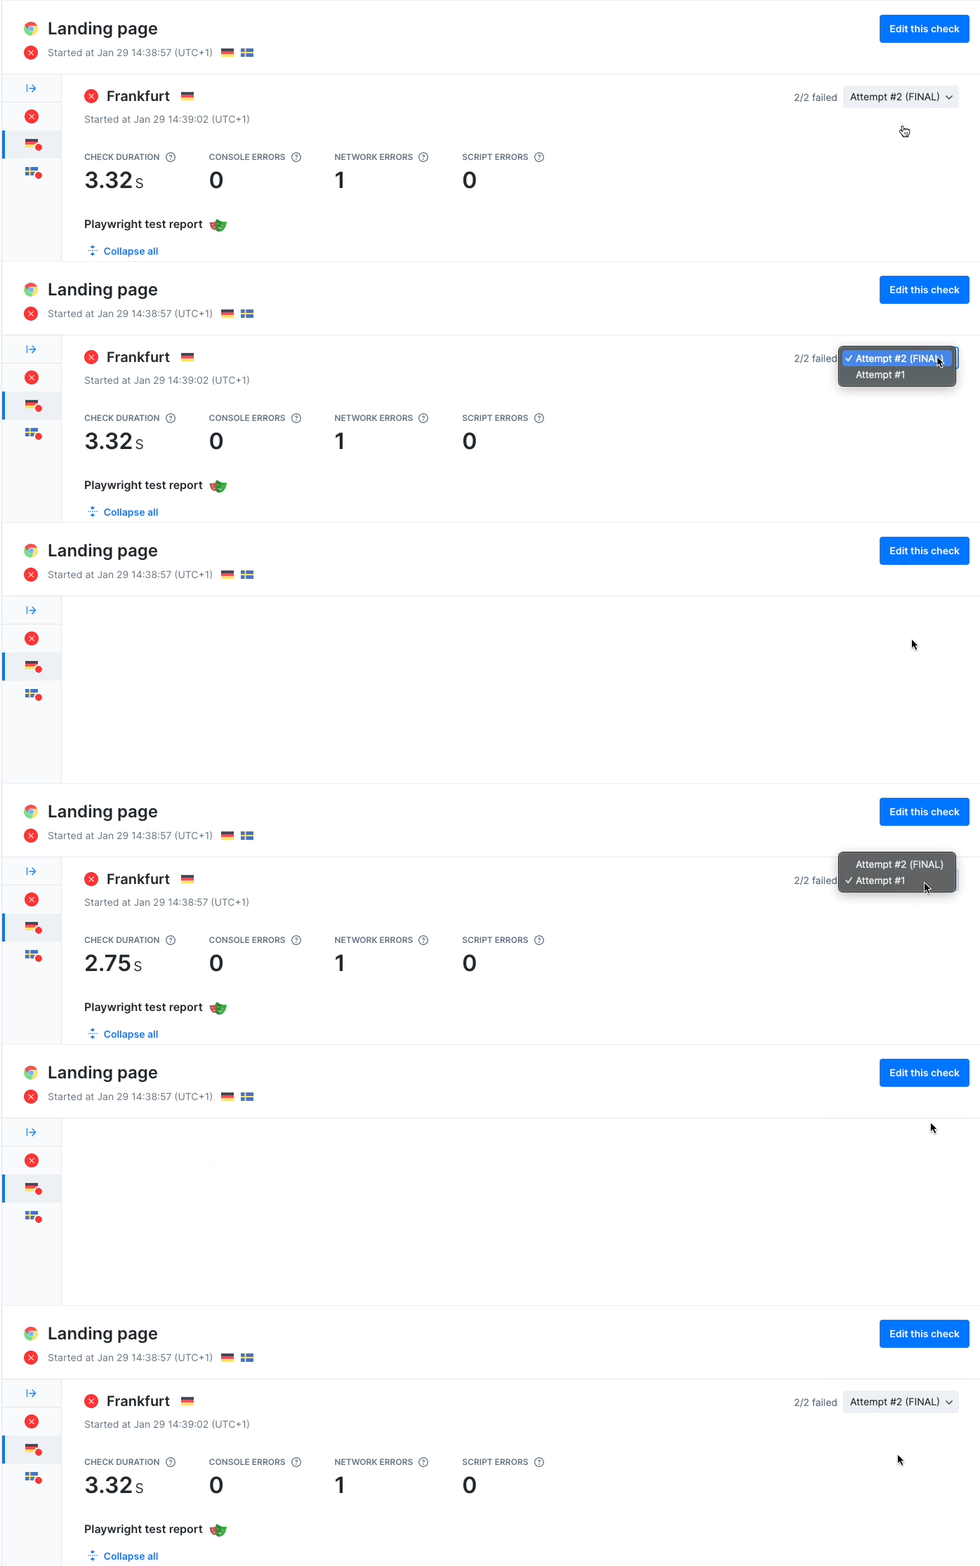
When checks are retried, a dropdown will indicate that the check result contains multiple check runs:
1. The initial failed attempt
2. The final result (which may have failed or succeeded)
When selecting a check run, all data and assets are available for inspection for each attempt.
Each result includes:
1. The HTTP request that was made
2. The response time
3. The result of any status code assertions configured in the monitor
4. For each request, we capture the following timing metrics:
* wait: time spent initializing the socket
* dns: DNS lookup time
* tcp: time to establish the TCP connection
* firstByte: time until the first byte of the response is received
* download: duration of the HTTP download
## Multistep check results
Multistep check results are navigated using the tree on the left side of the screen. If you are running checks in parallel, first select the location you are interested in.
In the result tree, the top node shows the check run log and the check run configuration.
Any errors encountered can be viewed in the 'Errors' node.
Each Playwright request is shown as a separate node under the test step in which it was performed. Selecting a request node opens the request details. Here you can view the request and response body, headers and any request parameters. A breakdown of the request timings is also available. If you've made assertions in the same test step as this request, then those assertions will be shown here.
The default request user-agent is `Checkly/1.0 (https://www.checklyhq.com)`.
If you would like to use a different user-agent, you can add `test.use({userAgent: 'customUserAgent'})` to your script.
Currently, only requests done using the Playwright `request` are shown as nodes in the tree, requests done via e.g Axios or HTTPS are not.
## TCP monitor results
On the [monitor results overview page](/images/docs/monitoring/check-results/#check-results-overview), select a specific check run to review its results:
* **Summary:** Displays the monitor target (URL and port), the monitor state (`success` for passed and degraded runs, or `error` for failed runs), the request status code and the total check run duration.
* **Error details:** If the check failed, the error status code and message log will be shown.
* **Timing phases:** For each request, we capture the following timing metrics:
* DNS: Time taken to resolve the hostname to an IP address (if a hostname was provided)
* Connect: Time taken to establish the TCP connection (SYN, SYN-ACK, ACK)
## Check results with retries
When checks are retried, a dropdown will indicate that the check result contains multiple check runs:
1. The initial failed attempt
2. The final result (which may have failed or succeeded)
When selecting a check run, all data and assets are available for inspection for each attempt.